. 2004 Jul 27;101(30):11001-6.
doi: 10.1073/pnas.0403588101. Epub 2004 Jun 22.

Global patterns of plant leaf N and P in relation to temperature and latitude

Affiliations

Global patterns of plant leaf N and P in relation to temperature and latitude

Peter B Reich et al. Proc Natl Acad Sci U S A. .

Abstract

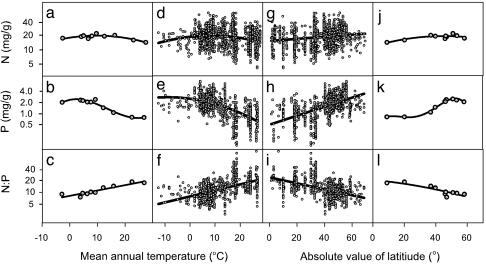
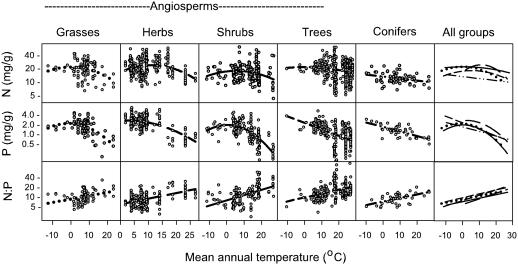
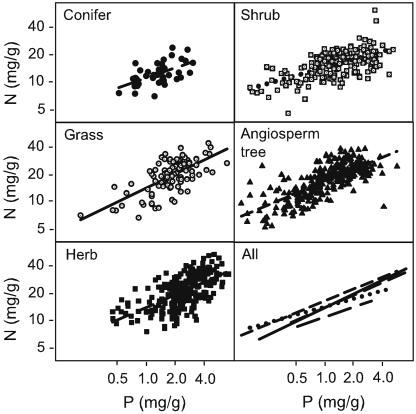
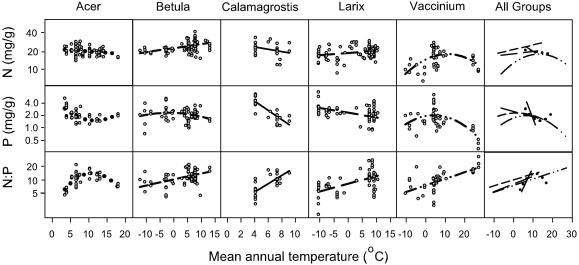
A global data set including 5,087 observations of leaf nitrogen (N) and phosphorus (P) for 1,280 plant species at 452 sites and of associated mean climate indices demonstrates broad biogeographic patterns. In general, leaf N and P decline and the N/P ratio increases toward the equator as average temperature and growing season length increase. These patterns are similar for five dominant plant groups, coniferous trees and four angiosperm groups (grasses, herbs, shrubs, and trees). These results support the hypotheses that (i) leaf N and P increase from the tropics to the cooler and drier midlatitudes because of temperature-related plant physiological stoichiometry and biogeographical gradients in soil substrate age and then plateau or decrease at high latitudes because of cold temperature effects on biogeochemistry and (ii) the N/P ratio increases with mean temperature and toward the equator, because P is a major limiting nutrient in older tropical soils and N is the major limiting nutrient in younger temperate and high-latitude soils.


Figures

Fig. 1.
Fig. 1.
Leaf N, P, and the leaf N/P ratio in relation to MAT and absolute latitude for all species averaged by species (di) and pooled within temperature bins (ac and jl). For all species, the fits for MAT were for leaf N (r2 = 0.05, P < 0.0001, n = 1,251) (d), leaf P (r2 = 0.39, P < 0.0001, n = 907) (e), and leaf N/P(r2 = 0.31, P < 0.0001, n = 894) (f). The fits for absolute value of latitude were for leaf N (r2 = 0.04, P < 0.0001, n = 1,235) (g), leaf P (r2 = 0.34, P < 0.0001, n = 908) (h), and leaf N/P(r2 = 0.24, P < 0.0001, n = 878) (i). For species in temperature bins (n = 10), the fits for MAT were for leaf N (r2 = 0.75, P < 0.008) (a), leaf P (r2 = 0.96, P < 0.001) (b), and leaf N/P(r2 = 0.85, P < 0.0001) (c). The fits for absolute value of latitude were for leaf N (r2 = 0.69, P = 0.02) (j), leaf P (r2 = 0.98, P < 0.001) (k), and leaf N/P(r2 = 0.77, P < 0.0008) (l). The full equations (for all figures) are provided in Table 1. The number of species in each MAT bin averaged 167, with a range from 72 to 292.
Fig. 2.
Fig. 2.
Leaf N, P, and N/P in relation to MAT for all species in five major plant groups. Among the angiosperm groups, for grasses the fits were for N (r2 = 0.10, P < 0.0001, n = 113), P (r2 = 0.11, P < 0.0001, n = 96), and N/P(r2 = 0.31, P < 0.0001, n = 95); for herbs, N (r2 = 0.08, P < 0.0001, n = 312), P (r2 = 0.35, P < 0.0001, n = 250), and N/P(r2 = 0.24, P < 0.0001, n = 244); for shrubs, N (r2 = 0.07, P < 0.0001, n = 212), P (r2 = 0.48, P < 0.0001, n = 173), and N/P(r2 = 0.25, P < 0.0001, n = 168); and for trees, N (r2 = 0.05, P < 0.0001, n = 491), P (r2 = 0.25, P < 0.0001, n = 302), and N/P(r2 = 0.20, P < 0.0001, n = 287). For the coniferous trees, the fits were for N (r2 = 0.10, P < 0.0001, n = 69), P (r2 = 0.49, P < 0.0001, n = 45), and N/P(r2 = 0.36, P < 0.0001, n = 45).
Fig. 3.
Fig. 3.
Leaf N in relation to leaf P for five plant groups, arrived at by using data averaged by species as in Fig. 2, is shown. For all groups, the following fits (all P < 0.0001) were linear: grass (r2 = 0.46, n = 96), herb (r2 = 0.38, n = 246), shrub (r2 = 0.37, n = 169), angiosperm tree (r2 = 0.58, n = 286), and conifer (r2 = 0.31, n = 45).
Fig. 4.
Fig. 4.
Leaf N, P, and N/P in relation to MAT for five genera are shown. The regression fits were as follows: Acer, for N (r2 = 0.06, P = 0.05, n = 70), P (r2 = 0.39, P < 0.0001, n = 43), and N/P(r2 = 0.54, P < 0.0001, n = 40); Betula, for N (r2 = 0.16, P < 0.0001, n = 86), P (r2 = 0.04, P = 0.09, n = 74), and N/P(r2 = 0.21, P < 0.0001, n = 71); Calamagrostis, for N (r2 = 0.10, P = 0.07, n = 33), P (r2 = 0.69, P < 0.0001, n = 33), and N/P(r2 = 0.57, P < 0.0001, n = 33); Larix, for N (r2 = 0.07, P = 0.005, n = 109), P (r2 = 0.22, P < 0.0001, n = 81), and N/P(r2 = 0.34, P < 0.0001, n = 80); and Vaccinium, for N (r2 = 0.23, P = 0.002, n = 50), P (r2 = 0.44, P < 0.0001, n = 47), and for N/P(r2 = 0.42, P < 0.0001, n = 45).

Comment in

References

    1. Sterner, R.W. & Elser, J. J. (2002) Ecological Stoichiometry: The Biology of Elements from Molecules to the Biosphere (Princeton Univ. Press, Princeton), pp. 1–439.
    1. Woods, H. A., Makino, W., Cotner, J. B., Hobbie, S. E., Harrison, J. F., Acharya, K. & Elser, J. J. (2003) Funct. Ecol. 17, 237–245.
    1. Hobbie, S. E., Schimel, J. P., Trumbore, S. E. & Randerson, J. R. (2000) Global Change Biol. 6, 196–210. - PubMed
    1. Food and Agriculture Organization of the United Nations (1998) World Soil Resources Report 84: World Reference Base for Soil Resources (Food and Agric. Org., Rome).
    1. U.S. Department of Agriculture/Natural Resources Conservation Service (2000) Global Soil Regions Map (U.S. Dept. Agric./Nat. Resources Conservat. Service, Washington, DC).

Publication types

LinkOut - more resources