. 2004 Jun 23;24(25):5778-88.
doi: 10.1523/JNEUROSCI.1382-04.2004.

Axonal growth is sensitive to the levels of katanin, a protein that severs microtubules

Affiliations

Axonal growth is sensitive to the levels of katanin, a protein that severs microtubules

Arzu Karabay et al. J Neurosci. .

Abstract

Katanin is a heterodimeric enzyme that severs microtubules from the centrosome so that they can move into the axon. Katanin is broadly distributed in the neuron, and therefore presumably also severs microtubules elsewhere. Such severing would generate multiple short microtubules from longer microtubules, resulting in more microtubule ends available for assembly and interaction with other structures. In addition, shorter microtubules are thought to move more rapidly and undergo organizational changes more readily than longer microtubules. In dividing cells, the levels of P60-katanin (the subunit with severing properties) increase as the cell transitions from interphase to mitosis. This suggests that katanin is regulated in part by its absolute levels, given that katanin activity is high during mitosis. In the rodent brain, neurons vary significantly in katanin levels, depending on their developmental stage. Levels are high during rapid phases of axonal growth but diminish as axons reach their targets. Similarly, in neuronal cultures, katanin levels are high when axons are allowed to grow avidly but drop when the axons are presented with target cells that cause them to stop growing. Expression of a dominant-negative P60-katanin construct in cultured neurons inhibits microtubule severing and is deleterious to axonal growth. Overexpression of wild-type P60-katanin results in excess microtubule severing and is also deleterious to axonal growth, but this only occurs in some neurons. Other neurons are relatively unaffected by overexpression. Collectively, these observations indicate that axonal growth is sensitive to the levels of P60-katanin, but that other factors contribute to modulating this sensitivity.


Figures

Figure 1.
Figure 1.
Sequence of rat P60-katanin and characterization of new peptide antibody. The sequence for rat P60-katanin was determined, and the deduced amino acid sequence is shown in I. The sequence data are available from GenBank, the European Molecular Biology Laboratory, and the DNA Data Bank of Japan under accession number AY621629. Sequence analysis of the P60-katanin cDNA clone revealed an open reading frame that encodes a 491 aa polypeptide, and a BLAST (basic local alignment search tool) search with the predicted sequence revealed that this polypeptide contains a conserved C-terminal AAA domain (amino acids 249-491; shown graphically below the sequence). The Walker A (P loop) motif is underlined in the amino acid sequence, and the specific site in the P loop that was mutated for the dominant-negative construct is shown in bold in the amino acid sequence and also indicated in the graph by the lightening bolt symbol. The region used for the peptide antibody is indicated in the graph by the double-ended arrow (corresponding to amino acids 115-148). II shows Western blotting and immunolabeling with the synthetic P60-katanin antibody. A single band at 60 kDa was recognized by the antibody in RFL6 cells and rat brain. The antibody proved to be effective for immunolabeling of cultures as shown in A and B. B shows a low-magnification field of HeLa cells after immunolabeling. Interphase cells show diffuse dim staining. Cells in various stages of mitosis show staining of the centrosomes and proximal half-spindles, as accentuated by higher magnification in A. Total levels of protein are markedly higher during mitosis than during interphase, suggesting rapid synthesis and degradation of the protein during the cell cycle. C shows quantitative analyses of immunofluorescence levels (in AFUs; values on the graph, ×1000) for RFL6 cells in mitosis and interphase; there is an 18% increase in mitosis compared with interphase. Scale bar: A, 5 μm; B, 13 μm. (The same scale bar represents different values in each panel.)
Figure 2.
Figure 2.
P60-katanin levels change in peripheral and central neurons during key stages of axonal development. A, B, Sections in situ hybridized (ISH) with a riboprobe specific for P60-katanin. DRG, Dorsal root ganglia; SC, spinal cord. P60-katanin mRNA is present in many cell types but is particularly abundant in the developing DRG (A, section from embryonic day 13 mouse). By E16, P60-katanin mRNA levels decline in DRG and surrounding tissues (B, section from an embryonic day 16 mouse). C-F, Sections immunolabeled (Immuno) for P60-katanin. C, P60-katanin protein is detected within the DRG but is more abundant in peripheral (arrows) and central (arrowheads) processes of sensory neurons. D, By E16, P60-katanin immunoreactivity is nearly undetectable in the DRG. Low levels of P60-katanin immunoreactivity were detected in spinal nerves containing the peripheral processes of sensory neurons (arrow). Some immunoreactivity also persisted in the spinal cord. E-I, P60-katanin is also expressed and shows changes in expression in the CNS. E, Tectum, embryonic day 13. As shown by immunolabeling, P60-katanin is present in cells and processes near the ventricle (arrowheads) and cells that have migrated toward the pia (arrows). F, Cerebral cortex, embryonic day 16. Labeling was observed in cells adjacent to the ventricle (arrowheads) and their processes. Labeled cells near the ventricle are radial glia or recently born neurons. Immunoreactive cells far from ventricular zones were probably postmigratory neurons of the early cortical plate (arrows). Thalamocortical axons within the cortical intermediate zone are also katanin-immunopositive (asterisks). G-I, P60-katanin expression in the hippocampus is also high in early postmigratory neurons and then declines with additional neuronal maturation. Sections from early postnatal mice in situ hybridized with a riboprobe specific for P60-katanin indicate the developmental changes in the level of P60-katanin. Arrowheads indicate the dentate gyrus, and the arrows indicate Ammon's horn. G, At postnatal day 1 (P1), expression is high in layers containing hippocampal neurons, including the dentate gyrus and Ammon's horn. P60-katanin is also expressed in specific layers of the developing cerebral cortex (asterisk, for example). H, By postnatal day 5, low levels of P60-katanin mRNA are present in neuronal layers throughout the hippocampus. I, By postnatal day 8, P60-katanin mRNA levels are very low and near the limits of detection throughout the hippocampus. Scale bar: A-D, 590 μm; E, F, 100 μm; G-I, 350 μm.
Figure 3.
Figure 3.
P60-katanin levels change in peripheral axons during development. A, B, High levels of P60-katanin were present along the lengths of axons in the fifth cranial nerve on embryonic day 13, from the distal tips of axons that had extended quite close to where their targets will develop in the snout (A, B, arrowheads) to more proximal bundles of axons (B, arrows). Whisker follicles, the locations of many mechanosensory targets of these axons, were not observed at E13. At E14.5, newly formed whisker follicles were present (D, asterisks). P60-katanin levels remained high in fifth nerve axons at this time, both in distal tips (C, D, arrowheads) and in proximal bundles (D, arrows). ByE16, P60-katanin was very low or absent in distal regions of sensory axons. E and F show regions of highest P60-katanin immunoreactivity in the E16 embryonic snout; little or no immunoreactivity was observed in neighboring sections (data not shown). By E16, immunoreactivity was low and extremely restricted in very distal regions of sensory axons (E, arrowheads) associated with whisker follicles (asterisks). Immunoreactivity was present in more proximal sections of the nerve (F, arrows) but at much lower levels in most axonal regions compared with E13 and E14.5. Scale bar, 240 μm.
Figure 4.
Figure 4.
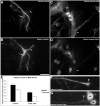
P60-katanin levels decrease with in 24 hr after axons encounter target cells. Basilar pontine neurons were grown in culture and double-labeled for β-tubulin and P60-katanin. In some cultures, the neurons were presented with cerebellar cells, mostly granule neurons, which are a physiological target for the basilar pontine axons; axonal growth ceases as the axons encounter the granule cells. A, Axons and growth cones immunolabeled for β-tubulin after 24 hr of extension from explants from basilar pontine nuclei explants growing on a laminin substrate in the absence of cerebellar cells. B, Same field as A, labeled for P60-katanin. Regions of the growth cone (shown here is a growth cone that has just recently bifurcated and given rise to two early axonal branches) that are particularly rich in P60-katanin have lower levels of tubulin immunofluorescence, probably reflecting microtubule-severing activity (A, B, arrows). C, Basilar pontine axons immunolabeled for β-tubulin (arrowhead) after 24 hr of coculture with dissociated cerebellar neurons. Cell bodies seen are cerebellar cells, mostly granule cell targets of basilar pontine axons. D, Same field as C, immunolabeled for P60-katanin. Although cerebellar cells often stain brightly for P60-katanin (asterisk, for example), basilar pontine axons have little or no immunoreactivity (arrowhead). E, MeanP60-katanin immunofluorescence in 10 μm axon segments at or near distal tips or in 10 μm segments located 35-100 μm more proximally within the same groups of axons. Distal and proximal segments were measured in nine axons contacting cerebellar cells (Cereb. Cells) and in nine axons not contacting cerebellar cells (Laminin). Mean katanin levels are significantly reduced in distal regions of basilar pontine axons contacting cerebellar cells, by 60% at or near growth cones or other types of axonal endings compared with basilar pontine axons not in contact with cerebellar cells in the same cultures (p < 0.03). Mean katanin levels in proximal axon segments were significantly reduced by 40% in basilar pontine axons contacting cerebellar cells compared with axons not contacting target cells in the same culture (p < 0.02). Mean katanin levels were in general significantly lower when comparing proximal and distal regions of the same axons regardless of whether they were in contact with cerebellar cells (30% reduction, axons not contacting cerebellar cells, p < 0.03; 46% reduction, axons contacting cerebellar cells, p < 0.005). F, Example of high katanin levels in a growth cone (arrowhead) and adjacent distal axon segment in a basilar pontine axon growing on laminin. Katanin levels are reduced in more proximal regions of this axon. G, Example of low katanin levels in a growth cone (arrowhead) in contact with target granule cells (asterisks) in the same culture as the axon in F. Note that katanin levels are also low in more proximal regions of the same axons, whereas katanin levels in the granule neurons are high. Scale bar: A-D, 25 μm; F, G, 14 μm.
Figure 5.
Figure 5.
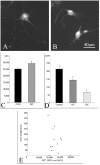
Expression of P60-katanin wild-type and dominant-negative constructs suppresses axonal outgrowth, but not in proportion to the levels of expression. GFP constructs of the wild-type or dominant-negative P60-katanin were transfected into rat sympathetic neurons. A shows immunostaining for P60-katanin in a neuron that was transfected with GFP alone, whereas B shows two neurons that were transfected with the wild-type construct. Axonal outgrowth is less robust in the neurons expressing the wild-type construct. C shows quantitative data on P60-katanin levels in control (CON) neurons and neurons expressing the wild-type (WT) constructs. The construct raises the total level of immunoreactivity by a mean of 16%, with fairly low variability from neuron to neuron. The dominant-negative construct expressed equally well (data not shown). D shows a marked diminution in axonal length relative to control neurons of neurons expressing the wild-type construct and an even greater diminution in neurons expressing the dominant-negative (DN) construct. E shows axonal length of individual neurons plotted against quantitative data on levels of GFP fluorescence after expression of the wild-type construct. There is no correlation between the amount of expression and the degree to which axonal outgrowth was stunted. A similar lack of correlation was observed with regard to the amount of expression of the dominant-negative and whether we quantified GFP fluorescence or P60-katanin fluorescence. Scale bar, 40 μm.
Figure 6.
Figure 6.
Morphological features differ in neurons expressing either the P60-katanin wild-type or a dominant-negative construct. Phase-contrast and fluorescence images of the transfected neurons after 8 hr of axonal out growth are shown. The neurons were still alive at the time the images were acquired. Fluorescence images are of GFP and are not augmented with antibody staining to enhance the intensity. In A, GFP alone is expressed in control neurons; expression does not alter the growth properties of the axon compared with nonexpressing neurons. Neurons expressing the dominant-negative construct often show a single short axon with a notable curve (B) or a single short axon with an abnormally thickened distal region (C). D-F show three other examples of neurons expressing the dominant-negative construct showing other morphologies. Neurons with no outgrowth at all were rare (an example is in shown in D), except with the replating experimental regimen (see Results). Neurons expressing the wild-type P60-katanin construct also rarely showed no axonal outgrowth at all (except in the replating regimen) but showed a notable reduction in size on the rare occasion when there was no outgrowth (G). Neurons expressing the wild-type P60-katanin construct typically showed short axons, often multiple in number (H). I-K show three other examples of neurons expressing the wild-type construct with varying degrees of axonal outgrowth. Neurons shown in both phase-contrast and fluorescence are labeled with capital and small letters, respectively, whereas neurons shown only in fluorescence are labeled with capital letters. Scale bar, 25 μm.
Figure 7.
Figure 7.
Replating of neurons expressing P60-katanin constructs results in two populations of wild-type-expressing neurons with regard to axonal outgrowth. Rat sympathetic neurons were allowed to express the constructs for 2 d and were then triturated, replated, and allowed to grow axons. Control neurons (expressing GFP alone) grew robust axonal arbors in 8 hr. Neurons expressing the dominant-negative construct were stunted in their growth, with approximately half showing no growth at all and the other half clearly stunted compared with controls. Neurons expressing the wild-type construct could be divided into two populations; half of the neurons grew no axons at all, whereas the other half grew axons at highly variable levels. The second population of wild-type expressers, analyzed apart from the first population, was not statistically different from the control neurons but showed more variability. In fact, some of these wild-type expressers grew longer axons than any of the control neurons, an example of which is shown in B. Also shown in B is a wild-type expresser that shows no axonal growth at all. The neurons in A and B are stained for microtubules to reveal their morphology. GFP fluorescence is shown in green. C shows the data graphically. CONT, Control (GFP alone); WT1, wild-type (including process-bearing neurons and neurons with no processes); DN1, dominant-negative (including process-bearing neurons and neurons with no processes); WT2, wild-type (only process-bearing neurons); DN2, dominant-negative (only process-bearing neurons). See Results for more details on data analysis. Scale bar: A, B, 50 μm.
Figure 8.
Figure 8.
Expression of the P60-katanin dominant-negative construct alters the microtubule array of cultured neurons. Both non-neuronal fibroblastic cells (A-C) and neurons (D-F) that exist within the cultures derived from rat sympathetic ganglia are shown. Optical sections were taken at different planes. Control non-neuronal cells show a typical radial array of microtubules emanating from a centrosomal region (A). Non-neuronal cells overexpressing the dominant-negative construct show an abnormal accumulation of microtubules, reflecting the expected partial inhibition of release (B, on a plane that accentuates the centrosome) and an apparent increased microtubule length compared with control cells (C, on a plane below the centrosome). A control neuron is shown in D, and an abnormal accumulation of microtubules, reflecting the expected partial inhibition of release, is also observed in neurons overexpressing the dominant-negative construct (E, on a plane that accentuates the centrosome). Neurons overexpressing the dominant-negative construct also showed an apparent increased microtubule length compared with control cells (F, on a plane below the centrosome). Note that the increases in microtubule length are only representative of alterations in microtubule length, because individual microtubules may traverse more than one optical section. Scale bar: A-F, 10 μm.
Figure 9.
Figure 9.
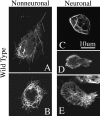
Expression of the P60-katanin wild-type construct alters the microtubule array of cultured neurons. Both non-neuronal fibroblastic cells (A, B) and neurons (C-E) that exist within the cultures derived from rat sympathetic ganglia are shown. Optical sections were taken at various planes. Non-neuronal cells expressing the construct show an absence of microtubules from the central region of the cell body, an overall diminution in total microtubule levels, and a notable abundance of very short microtubules. Microtubules several micrometers in length were also present (A), suggesting that some regions of the microtubules may be less susceptible to severing by katanin, perhaps because of microtubule-associated proteins that block access to the lattice. Neurons expressing the construct show comparable results (C-E). E is at a plane below the nucleus against the culture dish, revealing that not all microtubules scatter to the cell periphery after enhanced katanin-induced severing. Scale bar: A-E, 10 μm.

Similar articles

Cited by

References

    1. Ahmad FJ, Joshi HC, Centonze VE, Baas PW (1994) Inhibition of microtubule nucleation at the neuronal centrosome compromises axon growth. Neuron 12: 271-280. - PubMed
    1. Ahmad FJ, Echeverri CJ, Vallee RB, Baas PW (1998) Cytoplasmic dynein and dynactin are required for the transport of microtubules into the axon. J Cell Biol 140: 246-256. - PMC - PubMed
    1. Ahmad FJ, Yu W, McNally FJ, Baas PW (1999) An essential role for katanin in severing microtubules in the neuron. J Cell Biol 145: 305-315. - PMC - PubMed
    1. Ahmad FJ, Hughey J, Wittmann T, Hyman A, Greaser M, Baas PW (2000) Motor proteins regulate force interactions between microtubules and microfilaments in the axon. Nat Cell Biol 2: 276-280. - PubMed
    1. Avila J, Dominguez J, Diaz-Nido J (1994) Regulation of microtubule dynamics by microtubule-associated protein expression and phosphorylation during neuronal development. Int J Dev Biol 38: 13-25. - PubMed

Publication types

MeSH terms