The Iccare web server: an attempt to merge sequence and mapping information for plant and animal species
- PMID: 15215424
- PMCID: PMC441598
- DOI: 10.1093/nar/gkh460
The Iccare web server: an attempt to merge sequence and mapping information for plant and animal species
Abstract
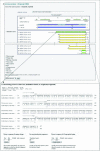
The Iccare web server, http://genopole.toulouse.inra.fr/bioinfo/Iccare, provides a simple yet efficient tool for crude EST (expressed sequence tag) annotation specifically dedicated to comparative mapping approaches. Iccare uses all the EST and mRNA sequences from public databases for an organism of interest (query species) and compares them to all the transcripts of one reference organism (Homo sapiens or Arabidopsis thaliana). The results are displayed according to the location of the genes on the chromosomes of the reference organism. Gene structure information and sequence similarities are combined in a graphical representation in order to pinpoint the nature of the transcript query sequence. The user can subsequently design primers or probes for the purpose of physical or genetic mapping. In addition to the query organisms already available in Iccare, users can perform a tailor-made search with their own sequences against the animal or plant reference organism genes.
Figures


Similar articles
-
SAGExplore: a web server for unambiguous tag mapping in serial analysis of gene expression oriented to gene discovery and annotation.Nucleic Acids Res. 2007 Jul;35(Web Server issue):W163-8. doi: 10.1093/nar/gkm429. Epub 2007 Jul 10. Nucleic Acids Res. 2007. PMID: 17626053 Free PMC article.
-
e2g: an interactive web-based server for efficiently mapping large EST and cDNA sets to genomic sequences.Nucleic Acids Res. 2004 Jul 1;32(Web Server issue):W301-4. doi: 10.1093/nar/gkh478. Nucleic Acids Res. 2004. PMID: 15215398 Free PMC article.
-
ESTIMA, a tool for EST management in a multi-project environment.BMC Bioinformatics. 2004 Nov 4;5:176. doi: 10.1186/1471-2105-5-176. BMC Bioinformatics. 2004. PMID: 15527510 Free PMC article.
-
Arabidopsis thaliana: a model plant for genome analysis.Science. 1998 Oct 23;282(5389):662, 679-82. doi: 10.1126/science.282.5389.662. Science. 1998. PMID: 9784120 Review.
-
Discovering new hormones, receptors, and signaling mediators in the genomic era.Mol Endocrinol. 2000 May;14(5):594-604. doi: 10.1210/mend.14.5.0472. Mol Endocrinol. 2000. PMID: 10809225 Review. No abstract available.
Cited by
-
Integrated maps in quail (Coturnix japonica) confirm the high degree of synteny conservation with chicken (Gallus gallus) despite 35 million years of divergence.BMC Genomics. 2006 May 2;7:101. doi: 10.1186/1471-2164-7-101. BMC Genomics. 2006. PMID: 16669996 Free PMC article.
-
Integrative mapping analysis of chicken microchromosome 16 organization.BMC Genomics. 2010 Nov 4;11:616. doi: 10.1186/1471-2164-11-616. BMC Genomics. 2010. PMID: 21050458 Free PMC article.
-
Phytome: a platform for plant comparative genomics.Nucleic Acids Res. 2006 Jan 1;34(Database issue):D724-30. doi: 10.1093/nar/gkj045. Nucleic Acids Res. 2006. PMID: 16381967 Free PMC article.
-
Transcriptome profiling of sheep granulosa cells and oocytes during early follicular development obtained by laser capture microdissection.BMC Genomics. 2011 Aug 18;12:417. doi: 10.1186/1471-2164-12-417. BMC Genomics. 2011. PMID: 21851638 Free PMC article.
-
Construction of a radiation hybrid map of chicken chromosome 2 and alignment to the chicken draft sequence.BMC Genomics. 2005 Feb 4;6:12. doi: 10.1186/1471-2164-6-12. BMC Genomics. 2005. PMID: 15693999 Free PMC article.
References
-
- Eichler E.E. and Sankoff,D. (2003) Structural dynamics of eukaryotic chromosome evolution. Science, 301, 793–797. - PubMed
-
- Goureau A., Garrigues,A., Tosser-Klopp,G., Lahbib-Mansais,Y., Chardon,P. and Yerle,M. (2001) Conserved synteny and gene order difference between human chromosome 12 and pig chromosome 5. Cytogenet. Cell Genet., 94, 49–54. - PubMed
MeSH terms
Substances
LinkOut - more resources
Full Text Sources
Research Materials

