

DICHROWEB, an online server for protein secondary structure analyses from circular dichroism spectroscopic data
- PMID: 15215473
- PMCID: PMC441509
- DOI: 10.1093/nar/gkh371
DICHROWEB, an online server for protein secondary structure analyses from circular dichroism spectroscopic data
Abstract
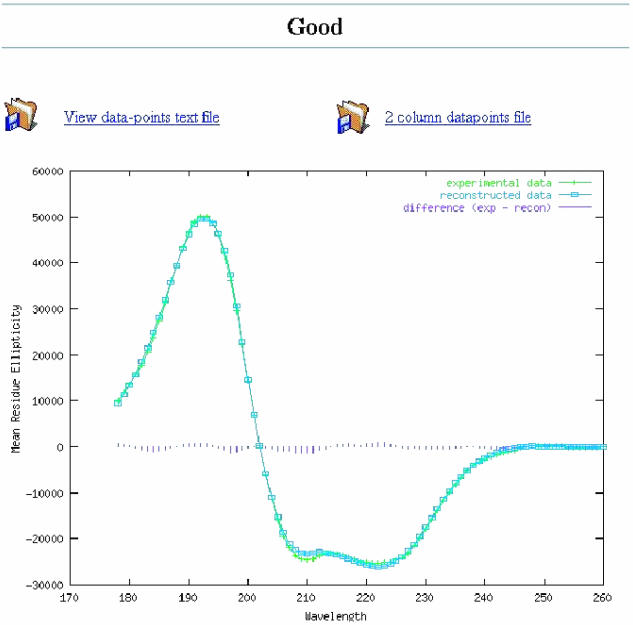
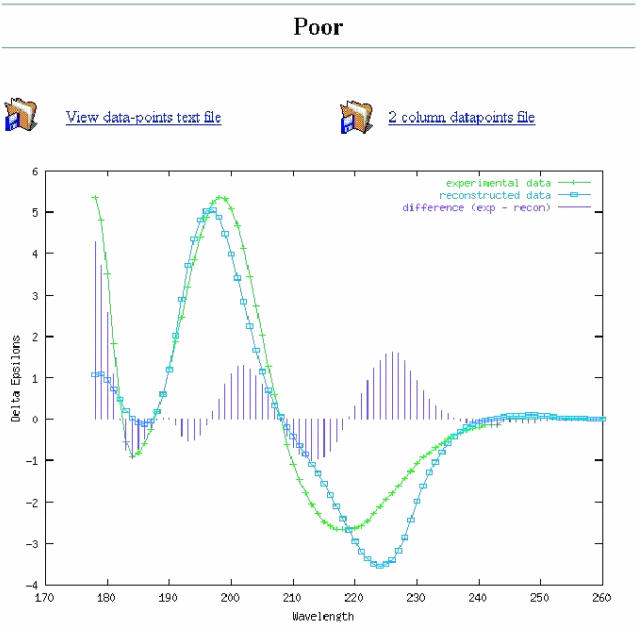
The DICHROWEB web server enables on-line analyses of circular dichroism (CD) spectroscopic data, providing calculated secondary structure content and graphical analyses comparing calculated structures and experimental data. The server is located at http://www.cryst.bbk.ac.uk/cdweb and may be accessed via a password-limited user ID, available upon completion of a registration form. The server facilitates analyses using five popular algorithms and (currently) seven different reference databases by accepting data in a user-friendly manner in a wide range of formats, including those output by both commercial CD instruments and synchrotron radiation-based circular dichroism beamlines, as well as those produced by spectral processing software packages. It produces as output calculated secondary structures, a goodness-of-fit parameter for the analyses, and tabular and graphical displays of experimental, calculated and difference spectra. The web pages associated with the server provide information on CD spectroscopic methods and terms, literature references and aids for interpreting the analysis results.
Figures
References
-
- Wallace B.A. (2000) Synchrotron radiation circular dichroism spectroscopy as a tool for investigating protein structures. J. Synchrotron Radiat., 7, 289–295. - PubMed
-
- Toumadje A., Alcorn,S.W. and Johnson,W.C., Jr (1992) Extending CD spectra of proteins to 168 nm improves the analysis for secondary structures. Anal. Biochem., 200, 321–331. - PubMed
-
- Sreerama N. and Woody,R.W. (1993) A self-consistent method for the analysis of protein secondary structure from circular dichroism. Anal. Biochem., 209, 32–44. - PubMed
-
- Provencher S.W. and Glockner,J. (1981) Estimation of globular protein secondary structure from circular dichroism. Biochemistry, 20, 33–37. - PubMed
MeSH terms
LinkOut - more resources
Full Text Sources
Other Literature Sources
