. 2004 Jul 21;23(14):2841-52.
doi: 10.1038/sj.emboj.7600274. Epub 2004 Jun 24.

Globin gene activation during haemopoiesis is driven by protein complexes nucleated by GATA-1 and GATA-2

Affiliations

Globin gene activation during haemopoiesis is driven by protein complexes nucleated by GATA-1 and GATA-2

Eduardo Anguita et al. EMBO J. .

Abstract

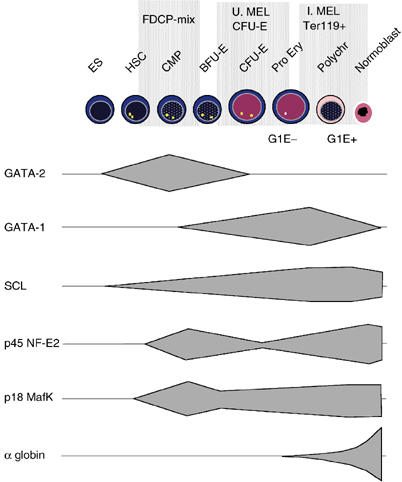
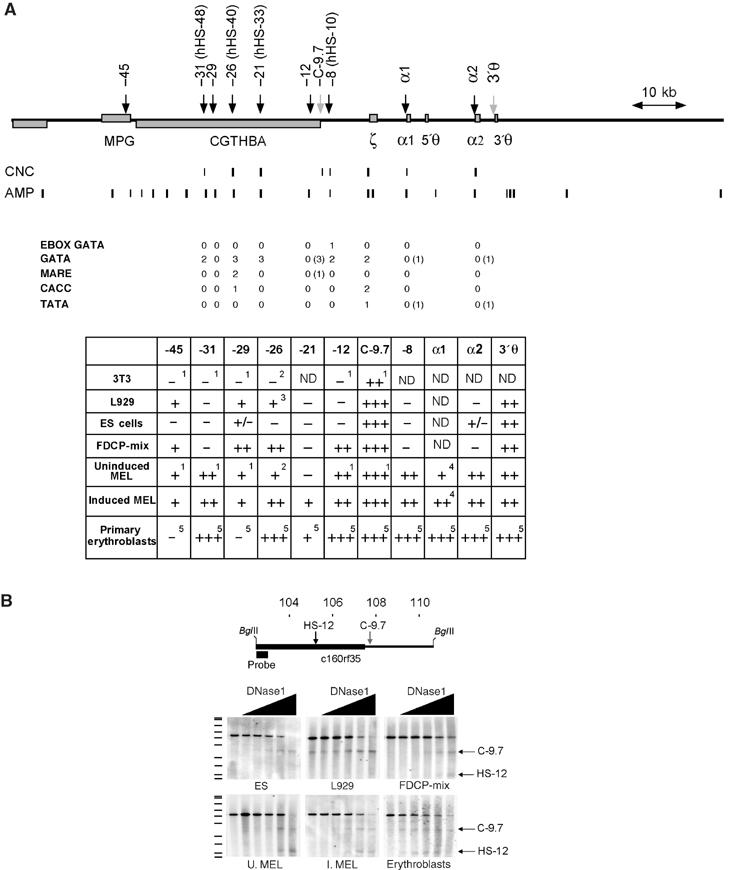
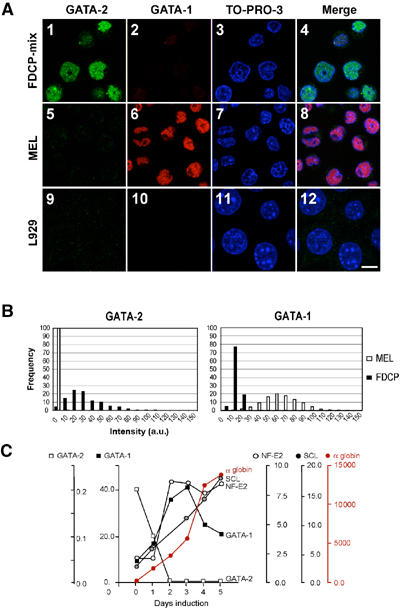
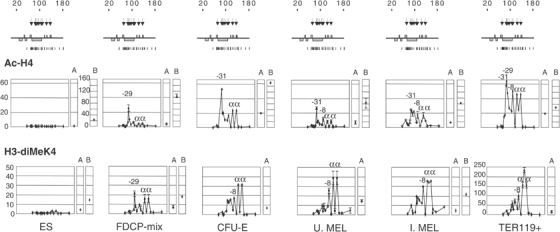
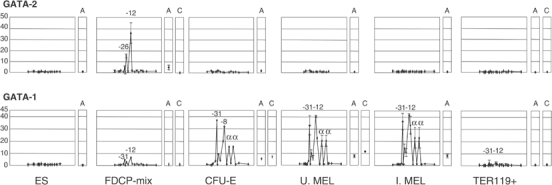
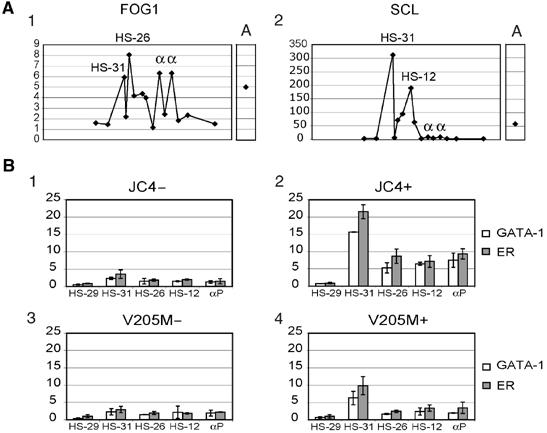
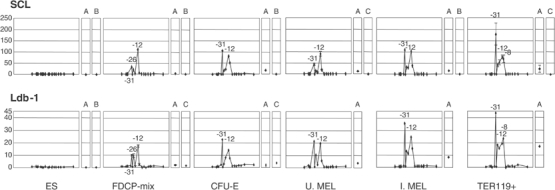
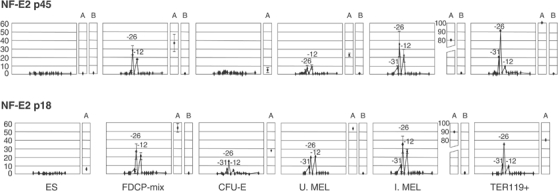
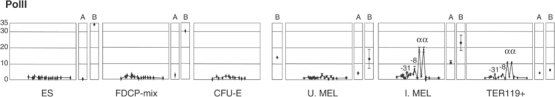
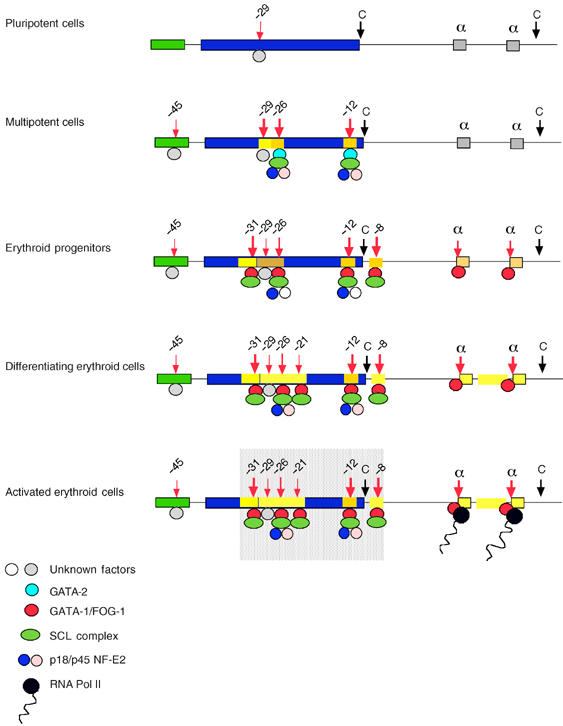
How does an emerging transcriptional programme regulate individual genes as stem cells undergo lineage commitment, differentiation and maturation? To answer this, we have analysed the dynamic protein/DNA interactions across 130 kb of chromatin containing the mouse alpha-globin cluster in cells representing all stages of differentiation from stem cells to mature erythroblasts. The alpha-gene cluster appears to be inert in pluripotent cells, but priming of expression begins in multipotent haemopoietic progenitors via GATA-2. In committed erythroid progenitors, GATA-2 is replaced by GATA-1 and binding is extended to additional sites including the alpha-globin promoters. Both GATA-1 and GATA-2 nucleate the binding of various protein complexes including SCL/LMO2/E2A/Ldb-1 and NF-E2. Changes in protein/DNA binding are accompanied by sequential alterations in long-range histone acetylation and methylation. The recruitment of polymerase II, which ultimately leads to a rapid increase in alpha-globin transcription, occurs late in maturation. These studies provide detailed evidence for the more general hypothesis that commitment and differentiation are primarily driven by the sequential appearance of key transcriptional factors, which bind chromatin at specific, high-affinity sites.


Figures

Figure 1
Figure 1
Expression of key transcription factors during erythropoiesis. Data were obtained from previously reported protein and mRNA analyses and observations reported in this study (see Supplementary data). ES, embryonic stem cell; HSC, haemopoietic stem cell; Pro Ery, proerythroblast; Polychr, polychromatic erythroblast; U. MEL, uninduced MEL cells; I. MEL, induced MEL cells; G1E−, G1E GATA-1-ER before estradiol treatment; G1E+, G1E GATA-1-ER after estradiol treatment. Although G1E cells were considered to be proerythroblasts recent data (Welch et al, submitted) suggests that they have some characteristics of BFU-E.
Figure 2
Figure 2
Erythroid-specific DNase1 HSs at the α-globin domain are mostly found at noncoding sequences that contain conserved transcription factor binding sites. (A) The mouse α-globin locus: erythroid-specific HSs (black arrows) and constitutive HSs C-9.7 and 3′θ (grey arrows) are shown. Coordinates relative to the ζ globin gene are indicated above the arrows. Coordinates of the human homologues are shown in parentheses. CNC, conserved noncoding sequences (Hughes et al, in preparation); AMP, amplicons used in real-time PCR. Below: The number of sequences for key transcription factor binding sites that are conserved throughout evolution are shown. Potential binding sites present only in mouse are shown in parentheses. The table summarises the results from DNase1 analysis in non-erythroid (L929 and 3T3, fibroblast cell lines) and erythroid cells (see text). 1Kielman et al (1996) and this study; 2Kielman et al (1994) and this study; 3+/− RAG cells, Gourdon et al (1995); 4Sheffery et al (1984); 5Anguita et al (2002). (B) HS mapping exemplifying the dynamics of erythroid-specific DNase1 HSs during erythropoiesis. Above: The area analysed in this experiment, showing BglII sites and the probe used. This fragment includes a constitutive DNase1 HS (C-9.7) associated with the promoter of the gene c16orf35 (CGTHBA), and the erythroid-specific site HS-12. Increasing concentrations of DNase1 (black triangles) demonstrate C-9.7 in all cell types. HS-12 can only be seen in FDCP-mix, MEL cells and primary erythroblasts. A faint band corresponding to C-9.7 is seen in L929 cells without added DNase1, probably due to endogenous nuclease activity. On the left of the autoradiograph is an 35S-labelled DNA marker (Amersham, Pharmacia Biotech, UK). U. MEL, uninduced MEL cells; I. MEL, induced MEL cells.
Figure 3
Figure 3
Changes in transcription factor expression during erythroid differentiation. (A) Immunofluorescence, illustrating the switch from GATA-2 (green) to GATA-1 (red) expression. (1–4) FDCP-mix cells express high levels of GATA-2 and low levels of GATA-1; (5–8) noninduced MEL cells show intense positivity for GATA-1; (9–12) L929 fibroblast cell line. The white bar represents ∼10 μm. (B) Quantification of immunofluorescence. Left: The relative intensity of GATA-2 staining in FDCP-mix (black bars) compared to uninduced MEL cells (white bars); the y-axis represents the proportion of cells (%) in each category. L929 nuclear fluorescence was subtracted as background. a.u., arbitrary units. Right: Fluorescence quantification of GATA-1. These experiments show that almost all FDCP-mix cells express both GATA transcription factors. Most cells express more GATA-2 than GATA-1, but there is considerable variability. A small number of cells are strongly positive for GATA-1, and these have a weaker GATA-2 staining and could represent cells that have started to differentiate along the erythroid lineage. (C) mRNA analysis by nuclease protection assay of the key erythroid transcription factors and α globin throughout MEL cell differentiation.
Figure 4
Figure 4
Histone modifications at the α-globin domain change during haemopoiesis. Above: Schematic representation of the α-globin locus as in Figure 2A, including erythroid-specific HSs (arrows) and real-time PCR amplicons (vertical lines). Below: Real-time PCR analysis of ChIP with antibodies against Ac-H4 and diMeK4. The y-axis represents enrichment over the GAPDH locus. The x-axis represents the coordinates at the α-globin locus. A, control sequence at HS2 of the β-globin LCR; B, control at the β-actin CpG island. The results from the different cells analysed are shown in the order of differentiation from left to right. Elements corresponding to the highest peaks of enrichment are indicated. Error bars correspond to ±1 s.d. from two independent ChIPs. Note the different scale for Ac-H4 β-actin control.
Figure 5
Figure 5
GATA-1 and GATA-2 bind to specific elements in the α-globin locus according to their expression pattern. Plots follow Figure 4. Above: GATA-2 binds only in FDCP-mix. Below: GATA-1 replaces GATA-2 as differentiation proceeds and binds most HSs, including the α-globin promoters. In late erythroblasts, no GATA binding is detected. A, HS2 of the β LCR; C, −2.8 region of the GATA-2 locus (Grass et al, 2003). Error bars represent ±1 s.d. from two independent ChIPs.
Figure 6
Figure 6
GATA-1 requires FOG-1 interaction for adequate DNA binding and/or recruitment to the α-globin locus. (A) (1) The pattern of FOG-1 binding to the α-globin cluster in U. MEL cells using newly established conditions for ChIP analysis. (2) As a control, SCL binding was analysed under the same conditions (compare with previously established conditions in Figure 7). A, HS2 of the β LCR. (B) GATA-1 ChIPs were analysed at GATA-1 binding sites (HS-31, -26, -12 and α-globin promoters) and at a site where GATA-1 does not bind (HS-29). ChIP analysis using anti-GATA-1 or anti-ER antibodies was performed with cells expressing wild-type GATA-1-ER (JC4) before (1) and after (2) estradiol induction, and in the V205M GATA-1-ER mutant, defective for FOG-1 binding, without (3) or with (4) estradiol treatment. The error bars represent ±1 s.d. from two independent ChIPs. αP, α-globin promoters.
Figure 7
Figure 7
The SCL complex binds to the α globin upstream HSs in a similar pattern to GATA factors, but not to the α-globin promoters. ChIP analysis of SCL (top) and Ldb-1 (bottom) in cells representing different stages of erythropoiesis. Plots follow Figure 4. A, HS2 of the β LCR; B, β-actin CpG island; C, −2.8 region of the GATA-2 locus (Grass et al, 2003). The error bars represent ±1 s.d. from two independent ChIPs.
Figure 8
Figure 8
NF-E2 binds in a bimodal fashion priming the α-globin cluster in multipotent progenitors and increasing again when α globin is expressed. ChIP assay on NF-E2 p45 (top) and p18 (bottom). Both subunits first bind in FDCP-mix to HS-26 and -12 in the same proportions. Later in differentiation (CFU-E), p45 disappears and only recovers the equilibrium with p18 subunit at stages in which α globin is expressed. This disequilibrium in p18 and p45 binding may prevent or activate α-globin transcription at different stages of haemopoiesis. At the β-globin cluster, the HS2 (A) shows a similar pattern.
Figure 9
Figure 9
RNA PolII is only detectable at the α-globin promoters late in differentiation. ChIP assay shows no enrichment of PolII in cells not expressing α globin. By contrast, the β-actin promoter (B) binds PolII in these cells, decreasing later in erythroid differentiation as the nucleus becomes pyknotic and expression of many genes (but not globin) is diminished. In globin-expressing cells (I. MEL and Ter119-selected cells), PolII binds not only the α-globin promoters but also β-HS2 as previously described (Johnson et al, 2002) (A). Simultaneously, very small enrichment of PolII can be detected upstream the α genes.
Figure 10
Figure 10
Summary of α-globin activation during erythroid differentiation. In pluripotent cells, the α cluster appears relatively inert, and only HS-29 appears to be bound and the significance of this is unknown. In multipotent cells, the cluster is primed in the upstream region by multiprotein complexes containing SCL and NF-E2 nucleated by GATA-2. HS-29 becomes very prominent and the associated histones are highly acetylated. Otherwise, only limited histone modifications (indicated by yellow boxes) are present. In committed erythroid progenitors, most HSs associated with conserved noncoding sequences are bound by multiprotein complexes containing various combinations of SCL and NF-E2, now nucleated by GATA-1. The α-globin promoters are also bound by GATA-1 either alone or as part of a different multiprotein complex. In differentiating erythroid cells, histone modifications extend throughout much of the locus, creating an erythroid-specific domain of histone hyperacetylation. The pattern of binding alters very little between cells expressing globin and those that do not. The exponential increase in globin mRNA synthesis would be consistent with cooperative interactions between proteins bound upstream of the cluster (shaded box) and multiprotein complexes, including PolII at the α-globin promoters.

References

    1. Andrews NC, Erdjument-Bromage H, Davidson MB, Tempst P, Orkin SH (1993a) Erythroid transcription factor NF-E2 is a haematopoietic-specific basic-leucine zipper protein. Nature 362: 722–728 - PubMed
    1. Andrews NC, Kotkow KJ, Ney PA, Erdjument-Bromage H, Tempst P, Orkin SH (1993b) The ubiquitous subunit of erythroid transcription factor NF-E2 is a small basic-leucine zipper protein related to the v-maf oncogene. Proc Natl Acad Sci USA 90: 11488–11492 - PMC - PubMed
    1. Anguita E, Johnson CA, Wood WG, Turner BM, Higgs DR (2001) Identification of a conserved erythroid specific domain of histone acetylation across the alpha-globin gene cluster. Proc Natl Acad Sci USA 98: 12114–12119 - PMC - PubMed
    1. Anguita E, Sharpe JA, Sloane-Stanley JA, Tufarelli C, Higgs DR, Wood WG (2002) Deletion of the mouse alpha-globin regulatory element (HS-26) has an unexpectedly mild phenotype. Blood 100: 3450–3456 - PubMed
    1. Bottardi S, Aumont A, Grosveld F, Milot E (2003) Developmental stage-specific epigenetic control of human beta-globin gene expression is potentiated in hematopoietic progenitor cells prior to their transcriptional activation. Blood 102: 3989–3997 - PubMed

MeSH terms