Comparative Study
. 2004 Jul 21;23(14):2713-22.
doi: 10.1038/sj.emboj.7600280. Epub 2004 Jun 24.

Structure of the N-terminal half of gelsolin bound to actin: roles in severing, apoptosis and FAF

Affiliations
Comparative Study

Structure of the N-terminal half of gelsolin bound to actin: roles in severing, apoptosis and FAF

Leslie D Burtnick et al. EMBO J. .

Abstract

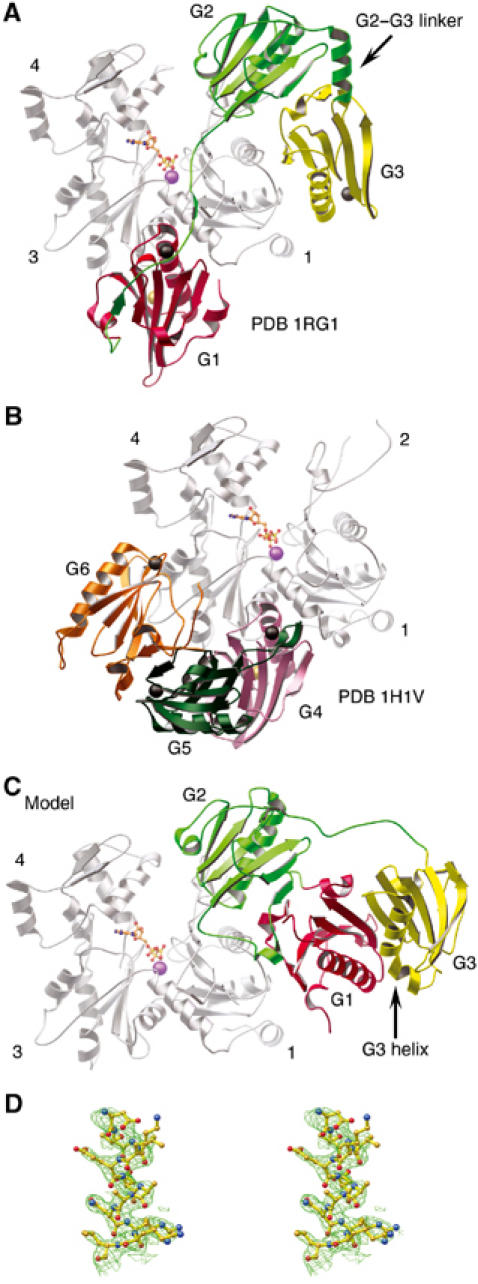
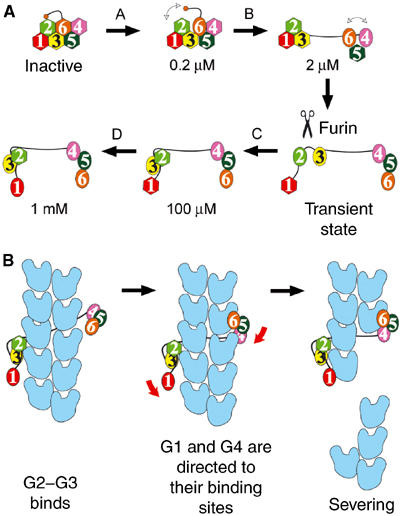
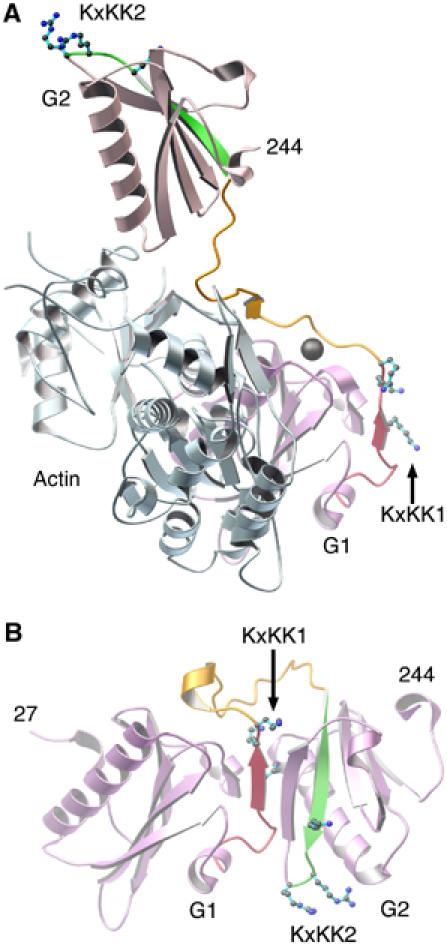
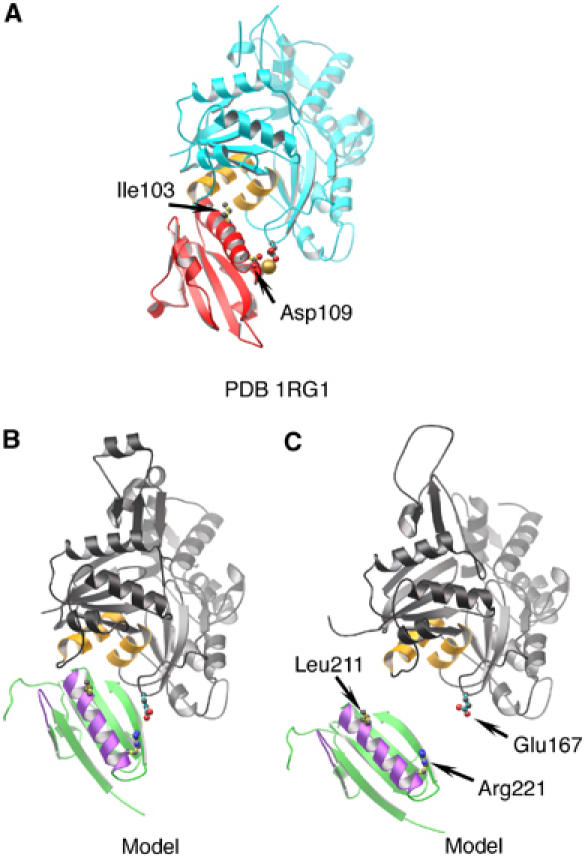
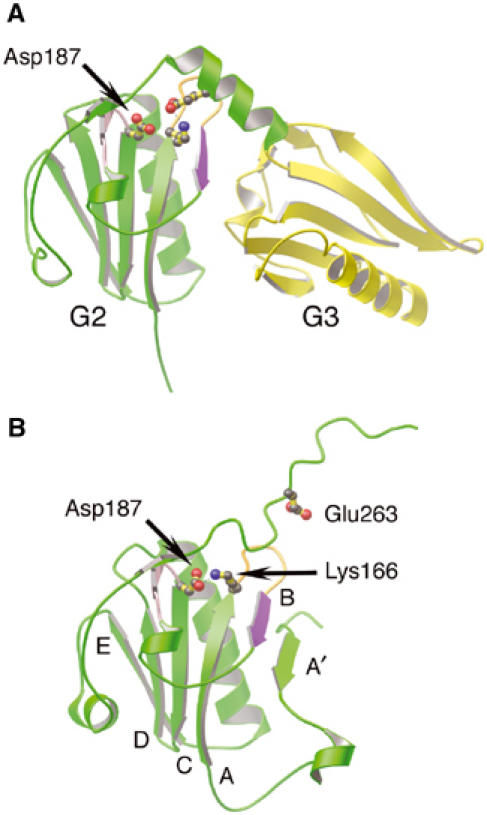
The actin filament-severing functionality of gelsolin resides in its N-terminal three domains (G1-G3). We have determined the structure of this fragment in complex with an actin monomer. The structure reveals the dramatic domain rearrangements that activate G1-G3, which include the replacement of interdomain interactions observed in the inactive, calcium-free protein by new contacts to actin, and by a novel G2-G3 interface. Together, these conformational changes are critical for actin filament severing, and we suggest that their absence leads to the disease Finnish-type familial amyloidosis. Furthermore, we propose that association with actin drives the calcium-independent activation of isolated G1-G3 during apoptosis, and that a similar mechanism operates to activate native gelsolin at micromolar levels of calcium. This is the first structure of a filament-binding protein bound to actin and it sets stringent, high-resolution limitations on the arrangement of actin protomers within the filament.


Figures

Figure 1
Figure 1
The structure of the G1–G3:actin complex. (A) A schematic representation of the G1–G3:actin complex. The gelsolin domains are colored: G1, red; G2, green; G3, yellow. This scheme is preserved in subsequent figures unless explicitly stated. Actin, with subdomains 1, 3 and 4 indicated, is colored gray. ATP is shown as a ball-and-stick representation with its associated Ca2+ in purple. Type-1 and type-2 Ca2+ ions are depicted as gold and black spheres, respectively. (B) The structure of the G4–G6:actin complex (PDB 1H1V; Choe et al, 2002) for comparison. Gelsolin domains are colored: G4, pink; G5, dark green; G6, orange. (C) Model of Ca2+-free G1–G3 interacting with actin: obtained by taking the structure of G1–G3 excised from Ca2+-free, inactive gelsolin (PDB 1D0N; Burtnick et al, 1997) and positioned on actin, in accord with the overlaying of G2 onto the structure presented in (A). (D) Stereo view of a representative portion of the 2FoFc electron density map contoured at 1σ.
Figure 2
Figure 2
Calcium-induced activation of gelsolin and the severing of F-actin. (A) Levels of calcium activation. Ca2+-free gelsolin domains are shown as hexagons and calcium-bound domains are depicted as ovals. Calcium ion concentrations are indicated for each step. The scissors represent the stage at which FAF gelsolin is cleaved. (B) The sequence of events during severing of actin by fully activated gelsolin. Actin protomers are shown in blue.
Figure 3
Figure 3
Regions of gelsolin involved in binding PIP2. (A) Activated G1 and G2 (pink) bound to actin (pale blue) as observed in the G1–G3:actin structure. PIP2-binding regions 132–140 and 161–172 are highlighted in red and green, respectively. Lysine residues from the KxKK motifs, within these regions, are drawn and labeled KxKK1 and KxKK2, respectively. The hydrophobic-rich G1–G2 linker, residues 141–160, is colored orange. The G1 type-2 calcium ion is drawn as a gray sphere. (B) G1–G2 excised from the Ca2+-free inactive form of gelsolin (PDB 1D0N; Burtnick et al, 1997). Colors are as in (A).
Figure 4
Figure 4
Model of a gelsolin-capped filament. (A) The ADP model of the actin filament (four protomers are drawn in blue and gray), with G1–G3:actin (1RGI) and G4–G6:actin (G4, pink; G5, dark green; G6, orange; PDB 1H1V; Choe et al, 2002) overlaid onto the barbed end. Purple spheres mark Asp371 of G3 and Met412 of G4, a gap of 63.1 Å to be bridged by the G3–G4 linker, which is modeled in purple. (B) A second view of the gelsolin-capped model filament, looking directly at the capped, barbed end. Three actin protomers are depicted. (C) The G1:actin structure (red:blue) with subdomain 2 of a second actin protomer from the ADP model drawn in black. The arrow indicates a steric clash between the long helix of G1 and the ADP helix of actin subdomain 2. (D) The tail latch. G2 (green) and the C-terminal tail (residues 736–755; orange) from inactive gelsolin positioned on the ADP model by overlaying G2 in (A). Only one actin from the filament is shown (gray). In this position, the C-terminal tail obscures the actin-binding site on G2.
Figure 5
Figure 5
Comparison of the G1 (structure) and G2 (model) interfaces with actin. (A) G1:actin structure (from 1RGI). G1 is red, with Ile103 and Asp109 drawn. The type-1 calcium ion is shown as a gold sphere. Actin is depicted cyan, with two relevant hydrophobic helices painted orange and residue Glu167 indicated. (B) The G2:actin interaction within the model presented in Figure 4A. G2 is shown in green, with F-actin contact regions in purple (Van Troys et al, 1996; Puius et al, 2000) and residues Leu211 and Arg221 indicated. An actin protomer is depicted in gray, with the two hydrophobic helices in orange and residue Glu167 drawn in. (C) G2 docked onto the EM model for the open conformation of an actin filament (Belmont et al, 1999).
Figure 6
Figure 6
Regions of gelsolin implicated in FAF. (A) Ribbon representation of G2 (green) and G3 (yellow) excised from the G1–G3:actin complex structure (1RGI). The loop preceding the C strand (pink), the A–B loop (orange) and the B strand (purple), containing the protease-sensitive site of FAF gelsolin (Arg172–Ala173), are highlighted. Residue Lys166 is depicted forming a salt bridge to Glu263, and the locus of FAF mutation, residue Asp187, is drawn. (B) Ribbon representation of G2 (green) from inactive gelsolin (PDB 1D0N; Burtnick et al, 1997). The FAF mutation residue, Asp187, is depicted forming an ion pair with Lys166. Residue Glu263 is also drawn. The β-strands are identified by letter. Mutation of Asp187, we propose, results in trapping G2–G3 between active (A) and inactive (B) states, increasing accessibility of the critical bond in the B strand (purple).

References

    1. Allen PG (2003) Actin filament uncapping localizes to ruffling lamellae and rocketing vesicles. Nat Cell Biol 5: 972–979 - PubMed
    1. Azuma T, Koths K, Flanagan L, Kwiatkowski D (2000) Gelsolin in complex with phosphatidylinositol 4,5-bisphosphate inhibits caspase-3 and -9 to retard apoptotic progression. J Biol Chem 275: 3761–3766 - PubMed
    1. Belmont LD, Orlova A, Drubin DG, Egelman EH (1999) A change in actin conformation associated with filament instability after Pi release. Proc Natl Acad Sci USA 96: 29–34 - PMC - PubMed
    1. Brünger AT, Adams PD, Clore GM, DeLano WL, Gros P, Crosse-Kunstleve RW, Jiang JS, Kuszewski J, Nilges M, Pannu NS, Read RJ, Rice LM, Simonson T, Warren GL (1998) Crystallography & NMR system: a new software suite for macromolecular structure determination. Acta Crystallogr D 54: 905–921 - PubMed
    1. Burtnick LD, Koepf EK, Grimes J, Jones EY, Stuart DI, McLaughlin PJ, Robinson RC (1997) The crystal structure of plasma gelsolin: implications for actin severing, capping, and nucleation. Cell 90: 661–670 - PubMed

Publication types

MeSH terms

Associated data