. 2004 Jul;53(7):1721-32.
doi: 10.2337/diabetes.53.7.1721.

In vivo and in vitro characterization of insulin-producing cells obtained from murine bone marrow

Affiliations

In vivo and in vitro characterization of insulin-producing cells obtained from murine bone marrow

Dong-Qi Tang et al. Diabetes. 2004 Jul.

Abstract

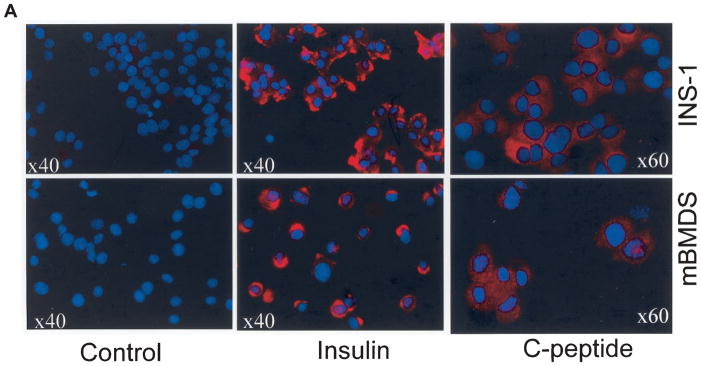
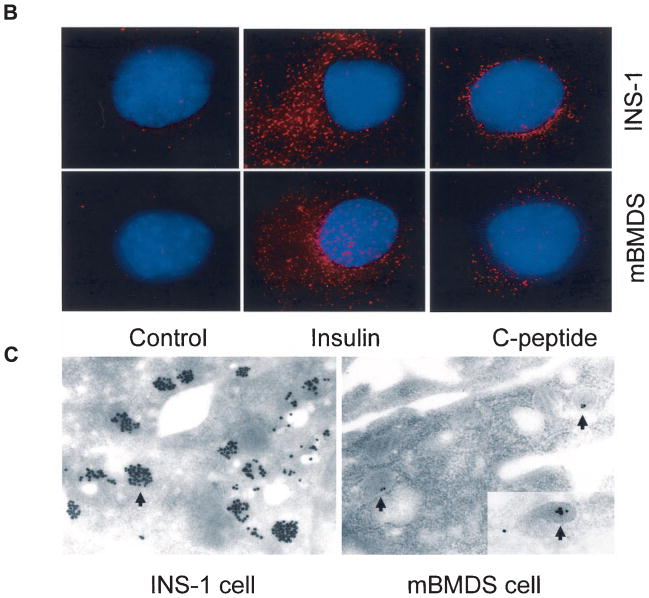
Efforts toward routine islet cell transplantation as a means for reversing type 1 diabetes have been hampered by islet availability as well as allograft rejection. In vitro transdifferentiation of mouse bone marrow (BM)-derived stem (mBMDS) cells into insulin-producing cells could provide an abundant source of autologous cells for this procedure. For this study, we isolated and characterized single cell-derived stem cell lines obtained from mouse BM. In vitro differentiation of these mBMDS cells resulted in populations meeting a number of criteria set forth to define functional insulin-producing cells. Specifically, the mBMDS cells expressed multiple genes related to pancreatic beta-cell development and function (insulin I and II, Glut2, glucose kinase, islet amyloid polypeptide, nestin, pancreatic duodenal homeobox-1 [PDX-1], and Pax6). Insulin and C-peptide production was identified by immunocytochemistry and confirmed by electron microscopy. In vitro studies involving glucose stimulation identified glucose-stimulated insulin release. Finally, these mBMDS cells transplanted into streptozotocin-induced diabetic mice imparted reversal of hyperglycemia and improved metabolic profiles in response to intraperitoneal glucose tolerance testing. These results indicate that mouse BM harbors cells capable of in vitro transdifferentiating into functional insulin-producing cells and support efforts to derive such cells in humans as a means to alleviate limitations surrounding islet cell transplantation.


Figures

FIG. 1
FIG. 1
Isolation, derivation, and characterization of clonal mBMDS cells. A: BM cells (2 × 10⁶ cells/ml) from Balb/c mice were plated and cultured for 2–7 days to obtain the adherent mBMDS cells (top). Cloned mBMDS cells were used for the in vitro differentiation protocol by culturing cells in the presence of a 23-mmol/l glucose concentration for various times. Many cell clusters at various stages of cluster formation during the course of induction of cell differentiation were observed, with a representative shown in the bottom panel. HG, high glucose; LG, low glucose. B: A representative phenotype of the mBMDS cells. FITC, fluorescein isothiocyanate; PE, phycoerythrin.
FIG. 2
FIG. 2
Gene expression patterns in D-mBMDS cells (high glucose, HG) and undifferentiated mBMDS cells (low glucose, LG). Total RNA was isolated from cultures of undifferentiated mBMDS (grown in LG medium for 4 months) and D-mBMDS (grown in HG medium for 4 months) cell cultures. RT-PCR was performed to detect genes related to β-cell development and insulin production. All PCR products were verified by DNA sequence analysis. The results were repeated at least three times.
FIG. 3
FIG. 3
Gene expression of nonpancreatic genes. Total RNA was isolated from cultures of undifferentiated (Un-D) and D-mBMDS (Dif) cell cultures. RT-PCR was performed to detect genes related to hepatic (A), neuronal (B), and intestinal (C) differentiation. GLP-1 receptor gene expression among cells (D) is presented. AFP, α fetal protein; GFAP, glial fibrillary acidic protein; MM, molecular marker; MUC2, mucin 2; NFM, neurofilament protein.
FIG. 4
FIG. 4
Confirmation of the mBMDS cell origin by microsatellite. Five mouse-specific probes were selected for studies of polymorphism to distinguish among species and among mouse strains. The sizes of the PCR products of the five markers (D2Mit30, D3Mit15, D6Mit15, D11Mit4, and D2Nds3) in Balb/c mice are 136, 143, 195, 242, and 400 bp, respectively.
FIG. 5
FIG. 5
A: Insulin and C-peptide production by D-mBMDS cells. Cytospin slides made of cultured D-mBMDS and INS-1 cells were stained with anti-insulin (middle) and anti–C-peptide (right) antibodies and visualized under fluorescence microscopy. INS-1 cells were used as a positive control for insulin and C-peptide. A negative control utilizing isotype-matched antibodies is shown (left). B: Analysis of insulin granules by deconvolution microscopy. The distribution of insulin and C-peptide granules in both INS-1 and D-mBMDS cells visualized by deconvolution microscopy following insulin and C-peptide immunostaining. Insulin and C-peptide molecules were stained in red color, and the nuclei were stained with DAPI (blue color). C: Analysis of insulin granules by electron microscopy. Immunogold labeling of insulin in INS-1 (left panel) and in D-mBMDS (right panel) cells is shown. Arrows indicate immunogold-labeled insulin granules.
FIG. 5
FIG. 5
A: Insulin and C-peptide production by D-mBMDS cells. Cytospin slides made of cultured D-mBMDS and INS-1 cells were stained with anti-insulin (middle) and anti–C-peptide (right) antibodies and visualized under fluorescence microscopy. INS-1 cells were used as a positive control for insulin and C-peptide. A negative control utilizing isotype-matched antibodies is shown (left). B: Analysis of insulin granules by deconvolution microscopy. The distribution of insulin and C-peptide granules in both INS-1 and D-mBMDS cells visualized by deconvolution microscopy following insulin and C-peptide immunostaining. Insulin and C-peptide molecules were stained in red color, and the nuclei were stained with DAPI (blue color). C: Analysis of insulin granules by electron microscopy. Immunogold labeling of insulin in INS-1 (left panel) and in D-mBMDS (right panel) cells is shown. Arrows indicate immunogold-labeled insulin granules.
FIG. 6
FIG. 6
Insulin release of mBMDS cells (□), D-mBMDS cells treated with exendin 4 (■), and D-mBMDS cells treated with exendin 9–39 ( formula image
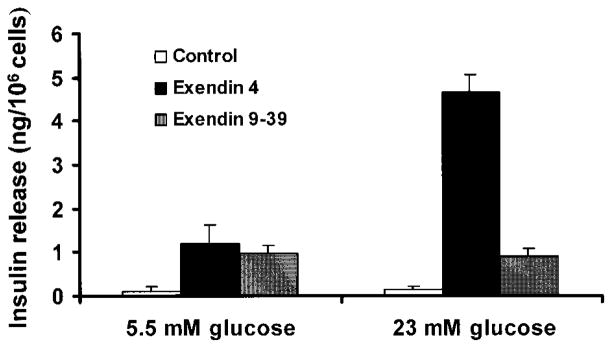
) upon glucose stimulation. Cells were cultured in RPMI 1640 medium containing 5.5 mmol/l glucose and 5% FCS, plus nicotinamide for 1 week and for an additional 1 week in the presence of either exendin 4 or exendin 9–39. The cells were then switched to serum-free medium containing 0.5% BSA for 12 h and then stimulated with 23 mmol/l glucose for 2 h. The cell culture medium was then collected for assay of insulin release. Released insulin in the media was detected by an ultrasensitive ELISA kit. Results shown here represent those of three separate experiments.
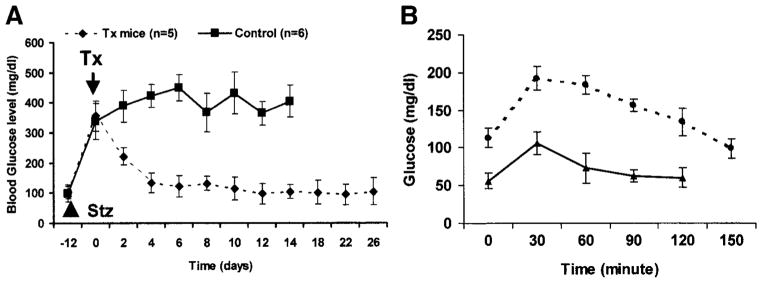
FIG. 7
FIG. 7
A: Cell transplantation using D-mBMDS cells. Balb/c mice became diabetic within 12 days after two intraperitoneal injections of 250 and 50 μg/g body wt STZ over 3 days apart. Glucose levels were monitored by tapped tail-vein blood at 1600 under nonfasting conditions. ■, blood glucose levels in sham surgery diabetic mice (n = 5); ◆, mBMDS cell–implanted mice after their glucose levels had reached >350 mg/dl (n = 6). The arrow indicates the day of implantation (shown as day 0). Values are means ± SD. B: Glucose responses during the IPGT test. Glucose tolerance was tested following an intraperitoneal injection of glucose (2 mg/g body wt) in overnight-fasted control (▲) (n = 5) and implanted (●) (n = 3) mice 14 days after transplantation. The venous blood was collected from the tail vein at 0, 30, 60, 90, 120, and 150 min after the injection. Values are means ± SD.
FIG. 8
FIG. 8
Flow cytometric analysis of apoptotic cells. Cells were cultured under high-glucose conditions for the indicated time periods, then collected for flow analysis. Intact cells were stained with Annexin-PE to detect outer-leaf phosphoserine, which is indicative of bilayer flipping and membrane blebbing in early apoptosis, and counterstained with the intercalating dye, 7AAD, to detect membrane permeability and chromatin degradation. Cells that stained with Annexin V but did not take up the 7AAD (upper left quadrant of each contour plot) were considered “apoptotic.” Cells that had background levels of Annexin V staining (set on untreated cell cultures, upper left panel) and no uptake of 7AAD were considered “viable and nonapoptotic.” The percentage of total cells (out of 10,000 detected events) in the “apoptotic” (upper left) quadrant and the “viable” (lower left) quadrant are given. PE, phycoerythrin

References

    1. Atkinson MA, Eisenbarth GS. Type 1 diabetes: new perspectives on disease pathogenesis and treatment. Lancet. 2001;358:221–229. - PubMed
    1. Shapiro AM, Lakey JR, Ryan EA, Korbutt GS, Toth E, Warnock GL, Kneteman NM, Rajotte RV. Islet transplantation in seven patients with type 1 diabetes mellitus using a glucocorticoid-free immunosuppressive regimen. N Engl J Med. 2000;343:230–238. - PubMed
    1. Gunnarsson R, Klintmalm G, Lundgren G, Wilczek H, Ostman J, Groth CG. Deterioration in glucose metabolism in pancreatic transplant recipients given cyclosporin. Lancet. 1983;2:571–572. - PubMed
    1. Kopen GC, Prockop DJ, Phinney DG. Marrow stromal cells migrate throughout forebrain and cerebellum, and they differentiate into astrocytes after injection into neonatal mouse brains. Proc Natl Acad Sci U S A. 1999;96:10711–10716. - PMC - PubMed
    1. Asahara T, Murohara T, Sullivan A, Silver M, van der ZR, Li T, Witzen-bichler B, Schatteman G, Isner JM. Isolation of putative progenitor endothelial cells for angiogenesis. Science. 1997;275:964–967. - PubMed

Publication types

MeSH terms