. 2004 Jul;78(14):7319-28.
doi: 10.1128/JVI.78.14.7319-7328.2004.

Human immunodeficiency virus type 1 infection of human brain-derived progenitor cells

Affiliations

Human immunodeficiency virus type 1 infection of human brain-derived progenitor cells

Diane M P Lawrence et al. J Virol. 2004 Jul.

Abstract

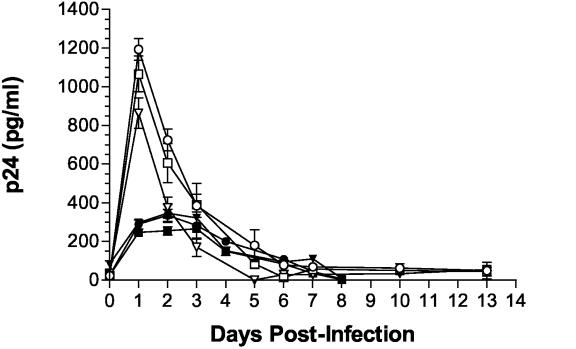
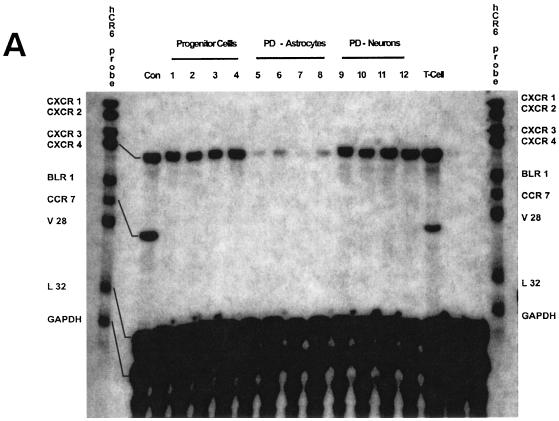
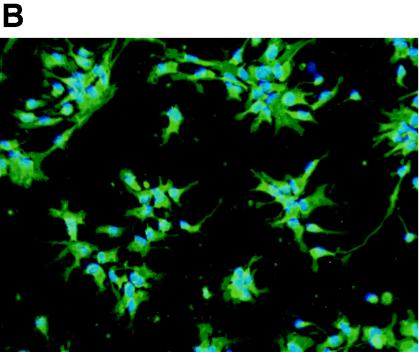
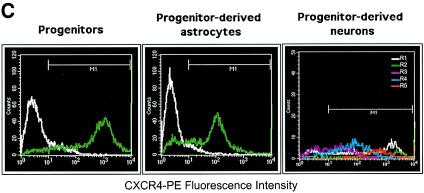
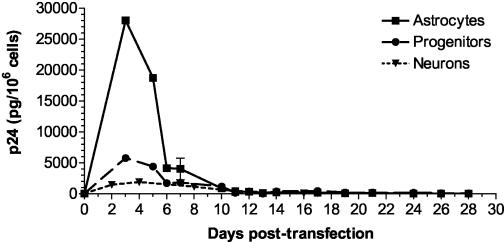
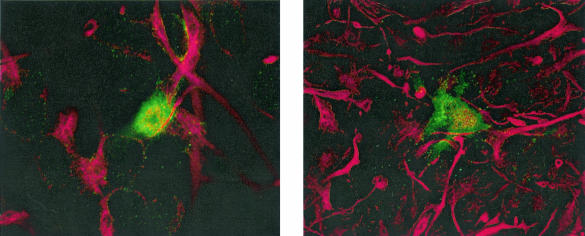
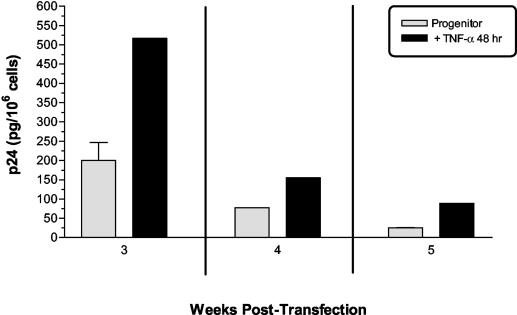
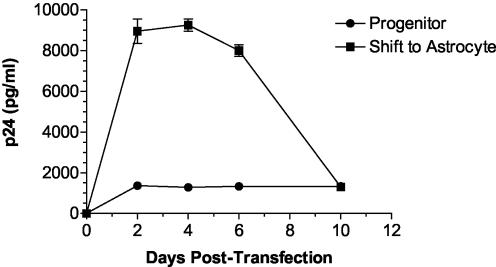
Although cells of monocytic lineage are the primary source of human immunodeficiency virus type 1 (HIV-1) in the brain, other cell types in the central nervous system, including astrocytes, can harbor a latent or persistent HIV-1 infection. In the present study, we examined whether immature, multipotential human brain-derived progenitor cells (nestin positive) are also permissive for infection. When exposed to IIIB and NL4-3 strains of HIV-1, progenitor cells and progenitor-derived astrocytes became infected, with peak p24 levels of 100 to 500 pg/ml at 3 to 6 days postinfection. After 10 days, virus production was undetectable but could be stimulated by the addition of tumor necrosis factor alpha (TNF-alpha). To bypass limitations to receptor entry, we compared the fate of infection in these cell populations by transfection with the infectious HIV-1 clone, pNL4-3. Again, transfected progenitors and astrocytes produced virus for 7 days but diminished to low levels beyond 8 days posttransfection. During the nonproductive phase, TNF-alpha stimulated virus production from progenitors as late as 5 weeks posttransfection. Astrocytes produced 5- to 20-fold more infectious virus (27 ng of p24/10(6) cells) than progenitors at the peak of 3 days posttransfection. Differentiation of infected progenitors toward an astrocyte phenotype increased virus production to levels consistent with infected astrocytes, suggesting a phenotypic difference in viral replication. Using this cell culture system of multipotential human brain-derived progenitor cells, we provide evidence that progenitor cells may be a reservoir for HIV-1 in the brains of AIDS patients.


Figures

FIG. 1.
FIG. 1.
Productive HIV-1 infection of progenitor and progenitor-derived astrocyte cultures. Cells were plated at identical densities in polylysine-coated 12-well plates and incubated for 6 to 8 h with low-serum NL4-3 or IIIB virus (at least 10,000 pg of p24/ml plus 20 μg of Polybrene/ml). Reduced levels in FCS were used to prevent the initiation of progenitor differentiation. Media was replaced after each collection on days indicated. The data represent means ± the standard deviations for triplicate wells in each condition at each time point. Similar data were obtained in three separate experiments. Symbols: ○, Astro NL4-3, 5% FCS; □, Astro IIIB, 5% FCS; ▿, Astro IIIB, 1% FCS; •, Prog NL4-3, 5% FCS; ▪, Prog IIIB, 5% FCS; ▾, Prog IIIB, 1% FCS.
FIG. 2.
FIG. 2.
CXCR4 expression in human neural progenitor cells, astrocytes, and neurons. (A) Autoradiogram result of RPA for CC chemokine receptor expression in progenitors (lanes 1 to 4), progenitor-derived astrocytes (lanes 5 to 8), and progenitor-derived neurons (lanes 9 to 12). Cells were untreated (lanes 1, 3, 5, 7, 9, and 11) or stimulated with TNF-α (50 ng/ml; lanes 2, 4, 6, 8, 10, and 12). Total RNA was collected after 4 h (lanes 1, 2, 5, 6, 9, and 10) or 16 h (lanes 3, 4, 7, 8, 11, and 12). (B) Overlay of immunofluorescence staining of CXCR4 (green) and nuclei (blue) of progenitor cells, fixed with 4% paraformaldehyde. Magnification, ×180. (C) FACS histograms of CXCR4 cell surface staining in suspensions of live progenitor, progenitor-derived astrocyte, and progenitor-derived neuron cultures. For progenitors and astrocytes, the white histogram indicates staining with an isotype control antibody (mouse IgG2a), and the green histogram indicates CXCR4 staining. For neurons, CXCR4 fluorescence histograms are shown for each of five subpopulations based on forward versus side scatter. The mean fluorescence intensities for cells staining greater than background (M1 gate) and the percentages of cells with positive staining were as follows: progenitors, 1,067 (89% positive); astrocytes, 169 (75% positive); and neurons, 754 (79% positive). The mean fluorescence intensity values for the individual neuronal subpopulations were 1,047 (region 1), 2115 (region 2), 90 (region 3), 221 (region 4), and 757 (region 5).
FIG. 2.
FIG. 2.
CXCR4 expression in human neural progenitor cells, astrocytes, and neurons. (A) Autoradiogram result of RPA for CC chemokine receptor expression in progenitors (lanes 1 to 4), progenitor-derived astrocytes (lanes 5 to 8), and progenitor-derived neurons (lanes 9 to 12). Cells were untreated (lanes 1, 3, 5, 7, 9, and 11) or stimulated with TNF-α (50 ng/ml; lanes 2, 4, 6, 8, 10, and 12). Total RNA was collected after 4 h (lanes 1, 2, 5, 6, 9, and 10) or 16 h (lanes 3, 4, 7, 8, 11, and 12). (B) Overlay of immunofluorescence staining of CXCR4 (green) and nuclei (blue) of progenitor cells, fixed with 4% paraformaldehyde. Magnification, ×180. (C) FACS histograms of CXCR4 cell surface staining in suspensions of live progenitor, progenitor-derived astrocyte, and progenitor-derived neuron cultures. For progenitors and astrocytes, the white histogram indicates staining with an isotype control antibody (mouse IgG2a), and the green histogram indicates CXCR4 staining. For neurons, CXCR4 fluorescence histograms are shown for each of five subpopulations based on forward versus side scatter. The mean fluorescence intensities for cells staining greater than background (M1 gate) and the percentages of cells with positive staining were as follows: progenitors, 1,067 (89% positive); astrocytes, 169 (75% positive); and neurons, 754 (79% positive). The mean fluorescence intensity values for the individual neuronal subpopulations were 1,047 (region 1), 2115 (region 2), 90 (region 3), 221 (region 4), and 757 (region 5).
FIG. 3.
FIG. 3.
HIV-1 production from pNL4-3-transfected progenitors, astrocytes, and neurons. After transfection with the infectious HIV-1 clone pNL4-3, supernatants were collected, and the medium was replaced on the days indicated. The data represent means and standard deviations for triplicate wells in each condition at each time point. Similar data were obtained in three separate experiments. Cell-free supernatants from each these cultures were infectious to T cells, and infectivity (time to reach maximal infection of T cells) correlated with p24 measurements.
FIG. 4.
FIG. 4.
Immunofluorescence of HIV-1-transfected progenitor cells. Cells plated on poly-d-lysine-coated German glass coverslips were transfected with pNL4-3, fixed 3 to 4 days posttransfection, and stained with mouse anti-p24 antibody and rabbit antiserum against human nestin. Appropriate fluorophore-conjugated secondary antibodies were visualized by confocal microscopy, and controls confirmed a lack of cross-reactivity. Green, HIV-1 p24; red,= nestin.
FIG. 5.
FIG. 5.
Cytokine stimulation of HIV-1 production from transfected progenitor cells. At 3, 4, or 5 weeks after transfection with pNL4-3, progenitors or astrocytes were exposed for 48 h to TNF-α (50 ng/ml). The data represent mean values ± the standard deviations from supernatants sampled from triplicate wells of transfected progenitors.
FIG. 6.
FIG. 6.
Differentiation of pNL4-3-transfected progenitors toward an astrocyte phenotype stimulates virus production. Progenitors were plated and transfected with pNL4-3 as described earlier. Some wells were maintained as progenitors, whereas other wells were switched to astrocyte differentiation medium immediately after the transfection procedure. The data represent means ± the standard deviations of triplicate wells. Similar data were obtained in three separate experiments.

Similar articles

Cited by

References

    1. Adachi, A., H. E. Gendelman, S. Koenig, T. Folks, R. Willey, A. Rabson, and M. A. Martin. 1986. Production of acquired immunodeficiency syndrome-associated retrovirus in human and nonhuman cells transfected with an infectious molecular clone. J. Virol. 59:284-291. - PMC - PubMed
    1. An, S. F., M. Groves, B. Giometto, A. A. Beckett, and F. Scaravilli. 1999. Detection and localisation of HIV-1 DNA and RNA in fixed adult AIDS brain by polymerase chain reaction/in situ hybridisation technique. Acta Neuropathol. 98:481-487. - PubMed
    1. Bagasra, O., E. Lavi, L. Bobroski, K. Khalili, J. P. Pestaner, R. Tawadros, and R. J. Pomerantz. 1996. Cellular reservoirs of HIV-1 in the central nervous system of infected individuals: identification by the combination of in situ polymerase chain reaction and immunohistochemistry. AIDS 10:573-585. - PubMed
    1. Bell, J. E. 1998. The neuropathology of adult HIV infection. Rev. Neurol. 154:816-829. - PubMed
    1. Brack-Werner, R. 1999. Astrocytes: HIV cellular reservoirs and important participants in neuropathogenesis. AIDS 13:1-22. - PubMed

Substances