. 2004 Jul;78(14):7465-77.
doi: 10.1128/JVI.78.14.7465-7477.2004.

Short interfering RNA accumulation correlates with host recovery in DNA virus-infected hosts, and gene silencing targets specific viral sequences

Affiliations

Short interfering RNA accumulation correlates with host recovery in DNA virus-infected hosts, and gene silencing targets specific viral sequences

Padmanabhan Chellappan et al. J Virol. 2004 Jul.

Erratum in

  • J Virol. 2006 Jan;80(2):1064. Pita, Justin [added]

Abstract

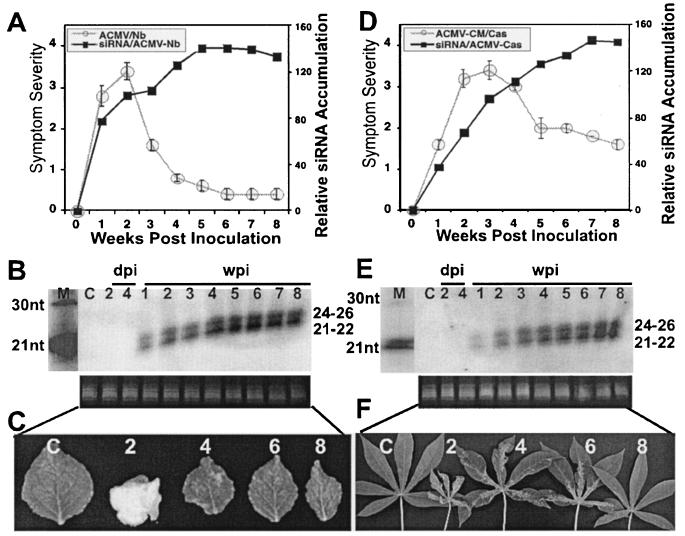
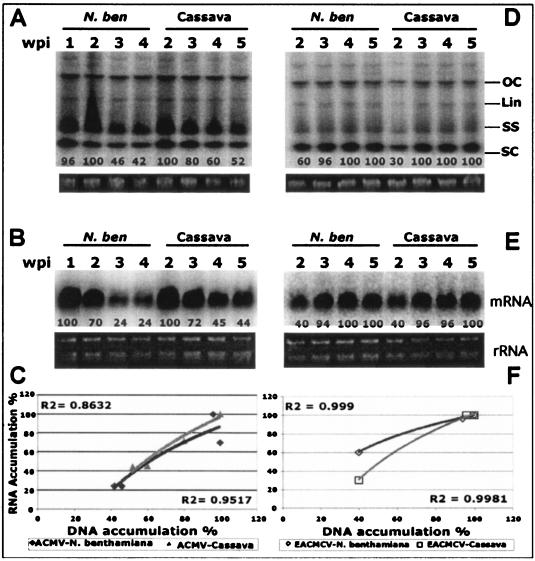
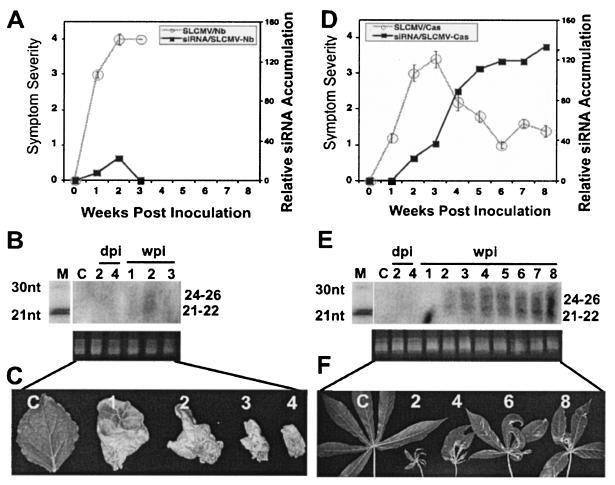
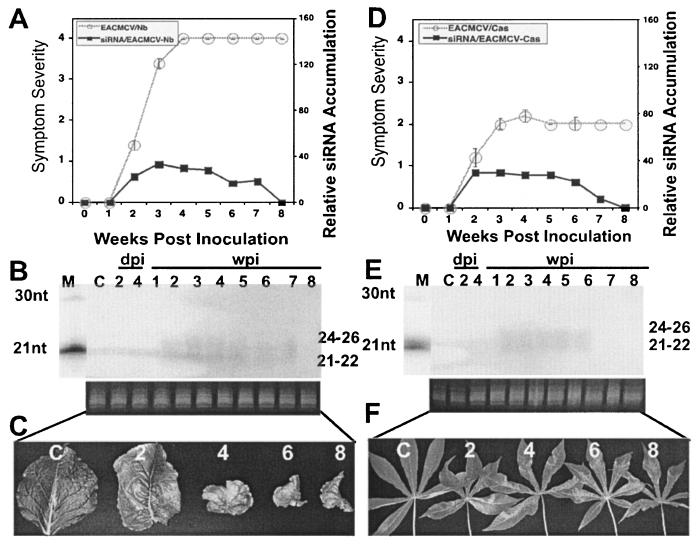
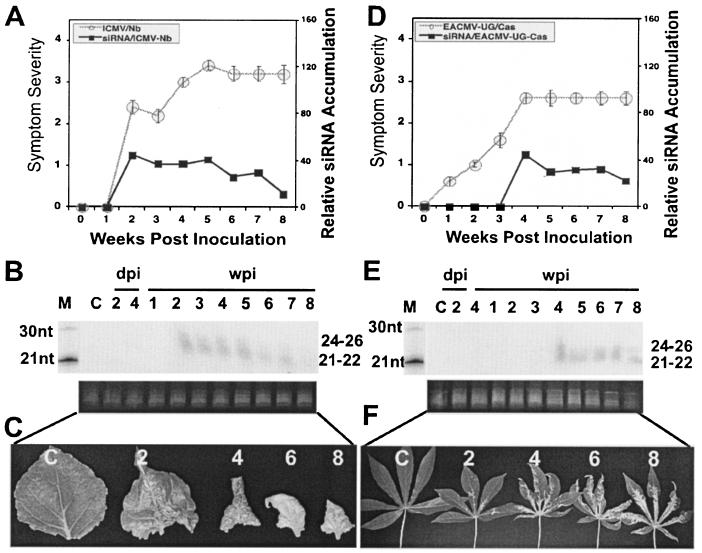
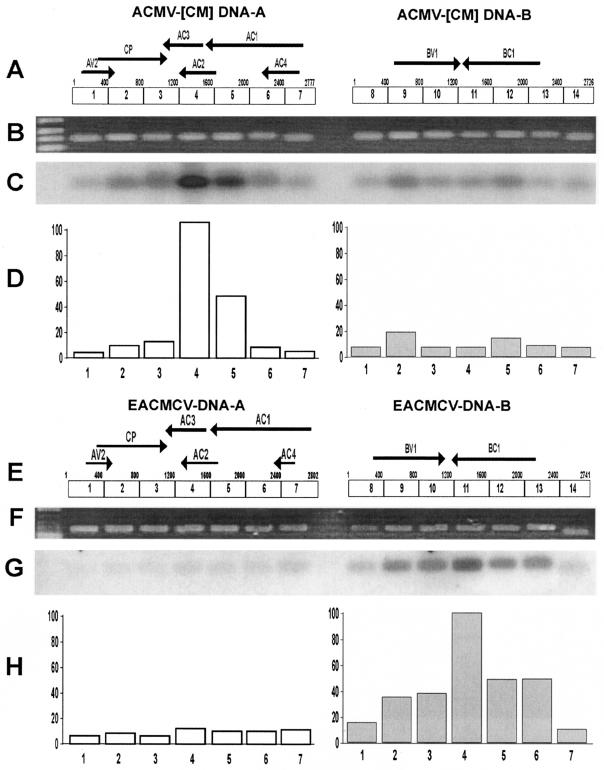
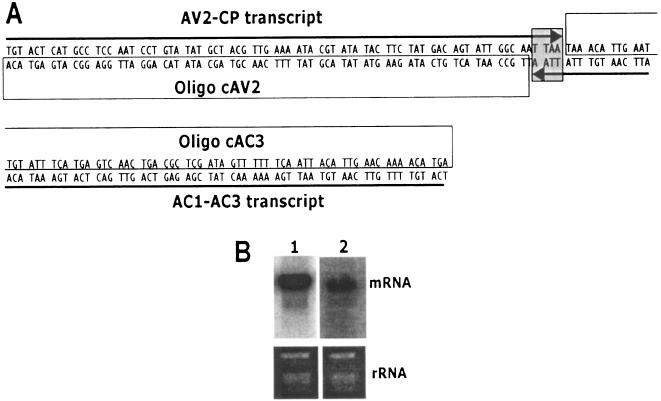
Viruses are both inducers and targets of posttranscriptional gene silencing (PTGS), a natural defense mechanism in plants. Here we report molecular evidence of the ability of single-stranded DNA (ssDNA) viruses to induce PTGS in infected plants irrespective of the severity of or recovery from the symptoms. Our results reveal that five distinct species of cassava-infecting geminiviruses were capable of triggering PTGS by producing two classes of virus-specific short interfering RNAs (siRNAs) of 21 to 26 nucleotides in two plant hosts, tobacco (Nicotiana benthamiana) and cassava (Manihot esculenta, Crantz). However, the efficacy of virus-induced PTGS varied depending on the intrinsic features of the virus and its interaction with the plant host. We found that symptom recovery over time in plants infected with the isolates of African cassava mosaic virus (ACMV-[CM]) or Sri Lankan cassava mosaic virus was associated with a much higher level of virus-derived siRNA accumulation compared to plants infected with viruses that do not show symptom recovery. Furthermore, we determined that the C terminus of AC1 that overlaps with the N terminus of AC2 early viral genes involved in virus replication were the primary targets for ACMV-[CM]-induced PTGS, whereas the C terminus of BC1 was targeted for the East African cassava mosaic Cameroon virus. In addition, our results reveal the possibility for double-stranded RNA formation during transcription in ssDNA viruses, which explains in part how these viruses can trigger PTGS in plants.


Figures

FIG. 1.
FIG. 1.
Relationship between symptom severity, recovery, and siRNA accumulation in ACMV-[CM]-infected N. benthamiana and cassava plants. (A and D) ACMV-[CM] symptom severity and siRNA accumulation trend in N. benthamiana (A) and in cassava (D). A total of 15 N. benthamiana and cassava plants were inoculated as five plants in three experiments. Bars in the symptom severity curve indicate the standard error (SE) values of 15 plants. (B and E) RNA gel blots probed with [∝-32P]dCTP-labeled DNA-A and DNA-B of ACMV-[CM] in N. benthamiana (B) and in cassava (E) at days 2 and 4 in inoculated leaves and at weeks 1 to 8 in systemically infected leaves. The left lane shows [γ-32P]ATP-end-labeled oligonucleotide markers of 21 and 30 nt. Each lane was loaded with 40 μg of low-molecular-weight RNA. Ethidium bromide-stained RNA is shown as a loading control. (C and F) Representative leaves showing different degrees of symptoms and recovery phenotypes at 2, 4, 6, and 8 wpi in N. benthamiana (C) and cassava (F). The C within the blots and leaf panels represents a mock-inoculated, control plant.
FIG. 2.
FIG. 2.
Levels of viral DNA and mRNA accumulation in ACMV-[CM] and EACMCV-infected N. benthamiana and cassava. (A and D) Southern blot analysis ACMV-[CM] DNA accumulation at 1, 2, 3, and 4 wpi in N. benthamiana and at 2, 3, 4, and 5 wpi in cassava (A) and EACMCV DNA accumulation at 2, 3, 4, and 5 wpi in N. benthamiana and cassava (D). Each lane was loaded with 4 μg of total genomic DNA isolated from virus-infected plants. Different viral DNA forms—supercoiled (SC), single stranded (SS), linear (Lin), and open circular (OC)—are indicated. Ethidium bromide-stained gels at the bottom of each blot serve as loading control. (B and E) Northern blot analysis of ACMV-[CM] mRNA accumulation at 1, 2, 3, and 4 wpi in infected N. benthamiana and 2, 3, 4, and 5 wpi in infected cassava (B) and of EACMCV viral mRNA accumulation at 2, 3, 4, and 5 wpi in infected N. benthamiana and cassava (E). Total RNA (2 μg) isolated from virus-infected plants was loaded into each lane. Blots were hybridized with [∝-32P]dCTP-labeled ACMV-[CM]-specific (A and B) and EACMCV-specific (D and E) probes. Ethidium bromide-stained rRNA was shown as the loading control. (C and F) Correlation of viral DNA and mRNA accumulation in ACMV-[CM]-infected (C) and EACMCV-infected (F) N. benthamiana and cassava plants.
FIG. 3.
FIG. 3.
Relationship between symptom severity, recovery, and siRNA accumulation in SLCMV-infected N. benthamiana and cassava plants. (A and D) SLCMV symptom severity and siRNA accumulation curves in N. benthamiana (A) and cassava (D). A total of 15 N. benthamiana and cassava plants were inoculated as five plants in three experiments. Bars in the symptom severity curve indicate the SE values of 15 plants. (B and E) RNA gel blots probed with [∝-32P]dCTP-labeled DNA-A and DNA-B of SLCMV in N. benthamiana (B) and in cassava (E) days 2 and 4 in inoculated leaves and at weeks 1 to 8 in systemically infected leaves. Each lane was loaded with 40 μg of low-molecular-weight RNA. Ethidium bromide-stained RNA is shown as a loading control. (C and F) Representative leaves showing different degree of symptoms and recovery phenotypes at 1, 2, 3, and 4 wpi in N. benthamiana (C) and at 2, 4, 6, and 8 wpi in cassava (F). The C within the blots and leaf panels represents a mock-inoculated, control plant.
FIG. 4.
FIG. 4.
Relationship between symptom severity, recovery, and siRNA accumulation in EACMCV-infected N. benthamiana and cassava plants. (A and D) EACMCV symptom severity and siRNA accumulation curves in N. benthamiana (A) and cassava (D). A total of 15 N. benthamiana and cassava plants were inoculated as five plants in three experiments. Bars in symptom severity curve indicate the SE values of 15 plants. (B and E) RNA gel blots probed with [∝-32P]dCTP-labeled DNA-A and DNA-B of EACMCV in N. benthamiana (B) and in cassava (E) at days 2 and 4 in inoculated leaves and at weeks 1 to 8 in systemically infected leaves. Each lane was loaded with 40 μg of low-molecular-weight RNA. Ethidium bromide-stained RNA is shown as a loading control. (C and F) Representative leaves showing different degree of symptoms and recovery phenotype at 2, 4, 6, and 8 wpi in N. benthamiana (C) and in cassava (F). The C within the blots and leaf panels represents a mock-inoculated, control plant.
FIG. 5.
FIG. 5.
Relationship between symptom severity, recovery, and siRNA accumulation in ICMV-infected N. benthamiana and in EACMV-[UG]-infected cassava plants. (A) ICMV symptom severity and siRNA accumulation trend in N. benthamiana. (B) RNA gel blot probed with [∝-32P]dCTP-labeled DNA-A and DNA-B of ICMV in N. benthamiana at days 2 and 4 in inoculated leaves and at weeks 1 to 8 in systemically infected leaves. (C) Representative leaves showing different degree of symptoms and recovery phenotype at 2, 4, 6, and 8 wpi in N. benthamiana. (D) EACMV-[UG] symptom severity and siRNA accumulation curves in cassava plants. (E) RNA gel blot probed with [∝-32P]dCTP-labeled DNA-A and DNA-B of EACMV-[UG] in cassava plants at days 2 and 4 in inoculated leaves and at weeks 1 to 8 in systemically infected leaves. (F) Representative leaves showing different degree of symptoms and recovery phenotype at 2, 4, 6, and 8 wpi in cassava plants. A total of 15 N. benthamiana plants for ICMV and 15 cassava plants for EACMV-[UG] were inoculated as five plants in three experiments. Ethidium bromide-stained RNA is shown as a loading control. Bars in symptom severity curve indicate the SE values of 15 plants. The C within the blots and leaf panels represents a mock-inoculated, control plant.
FIG. 6.
FIG. 6.
Identification of the origin of small 21- to 26-nt guide RNAs derived from ACMV-[CM] and EACMCV-infected N. benthamiana. (A) ACMV-[CM] genome consists of DNA-A (2,777 nt) and DNA-B (2,726 nt). PCR-amplified ∼400-bp DNA fragments 1 through 7 for DNA-A and PCR-amplified ∼400-bp DNA fragments 8 through 14 for DNA-B of ACMV-[CM] separated in an ethidium bromide-stained 1% agarose gel (B) were blotted and hybridized (C) with 5′-end-labeled small 21- to 26-nt guide RNAs purified from ACMV-[CM]-infected N. benthamiana. (D) Intensity of the obtained signals expressed as values of 0 to 100 (y axis), where the highest signal was scored as 100% by using ImageQuant (IqMacV1.2) software. Numbers in the x axis indicate the PCR-amplified DNA fragments. EACMCV genome comprises DNA-A (2,802 nt) and DNA-B (2,741 nt) (E). PCR-amplified ∼400-bp DNA fragments 1 through 7 for DNA-A and PCR-amplified ∼400-bp DNA fragments 8 through 14 for DNA-B, separated in an ethidium bromide-stained 1% agarose gel (F), were blotted and hybridized (G) with 5′-end-labeled small 21- to 26-nt guide RNAs isolated from EACMCV-infected N. benthamiana. (H) Intensity of the obtained signals expressed as values of 0 to 100, where the highest was scored as 100% by using ImageQuant software.
FIG. 7.
FIG. 7.
Transcript overlap at the 3′ ends of CP and AC3 genes in ACMV-[CM]. (A) Schematic representation of virion-sense CP gene and complementary-sense AC3 gene overlapped by 4 nt in ACMV-[CM]; (B) Northern blot analysis of total RNA (5 μg) isolated from ACMV-[CM]-infected N. benthamiana. An RNA blot (left) hybridized with CP strand-specific [γ-32P]ATP-labeled 70-mer (oligonucleotide cAV2), and the RNA blot (right) hybridized with AC3 strand-specific [γ-32P]ATP-labeled 70-mer (oligonucleotide cAC3) as the probe. Ethidium bromide-stained rRNA at the bottom of the blot serve as a loading control.

Similar articles

Cited by

References

    1. Al-Kaff, N. S., S. N. Covey, M. M. Kreike, A. M. Page, R. Pinder, and P. J. Dale. 1998. Transcriptional and posttranscriptional plant gene silencing in response to a pathogen. Science 279:2113-2115. - PubMed
    1. Anandalakshmi, R., G. J. Pruss, X. Ge, R. Marathe, A. C. Mallory, T. H. Smith, and V. B. Vance. 1998. A viral suppressor of gene silencing in plants. Proc. Natl. Acad. Sci. USA 95:13079-13084. - PMC - PubMed
    1. Baulcombe, D. C. 1996. RNA as a target and an initiator of posttranscriptional gene silencing in transgenic plants. Plant Mol. Biol. 32:79-88. - PubMed
    1. Bernstein, E., A. A. Caudy, S. M. Hammond, and G. J. Hannon. 2001. Role for a bidentate ribonuclease in the initiation step of RNA interference. Nature 409:363-366. - PubMed
    1. Cock, J. H. 1985. Cassava: new potential for a neglected crop. Westview Press, Boulder, Colo.

Publication types

LinkOut - more resources