. 2004 Jul 6;101(27):10101-6.
doi: 10.1073/pnas.0306602101. Epub 2004 Jun 25.

Species and functional group diversity independently influence biomass accumulation and its response to CO2 and N

Affiliations

Species and functional group diversity independently influence biomass accumulation and its response to CO2 and N

Peter B Reich et al. Proc Natl Acad Sci U S A. .

Abstract

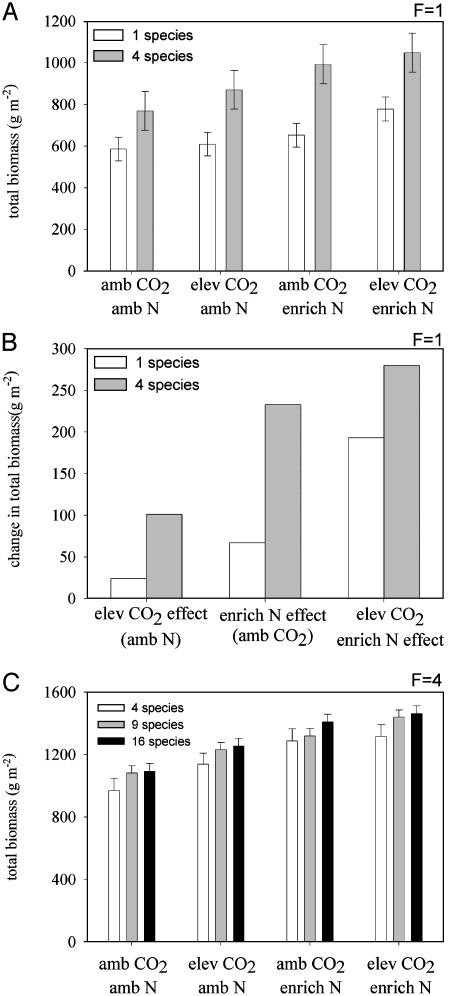
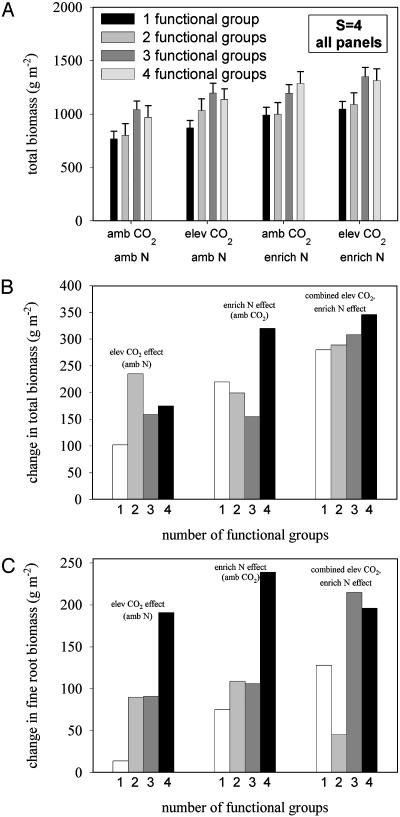
The characteristics of plant assemblages influence ecosystem processes such as biomass accumulation and modulate terrestrial responses to global change factors such as elevated atmospheric CO(2) and N deposition, but covariation between species richness (S) and functional group richness (F) among assemblages obscures the specific role of each in these ecosystem responses. In a 4-year study of grassland species grown under ambient and elevated CO(2) and N in Minnesota, we experimentally varied plant S and F to assess their independent effects. We show here that at all CO(2) and N levels, biomass increased with S, even with F constant at 1 or 4 groups. Likewise, with S at 4, biomass increased as F varied continuously from 1 to 4. The S and F effects were not dependent upon specific species or functional groups or combinations and resulted from complementarity. Biomass increases in response to CO(2) and N, moreover, varied with time but were generally larger with increasing S (with F constant) and with increasing F (with S constant). These results indicate that S and F independently influence biomass accumulation and its response to elevated CO(2) and N.


Figures

Fig. 1.
Fig. 1.
Effects of S at a standardized F on biomass and biomass responses to elevated CO2 and enriched N. (A) In experiment I, total biomass (above-ground plus below-ground, 0–20 cm in depth; +1 SE) for plots planted with one functional group (F = 1) and either one or four species, grown at four combinations of ambient (368 μmol·mol-1) and elevated (560 μmol·mol-1) concentrations of CO2 and ambient N and enriched N (4 g·m-2·year-1). Data were averaged over two harvests in each year from 1998 to 2001. (B) In experiment I, the change in total biomass (compared with ambient levels of both CO2 and N) in response to elevated CO2 alone (at ambient N), to enriched N alone (at ambient CO2), and to the combination of elevated CO2 and enriched N, pooled across years, for plots with F = 1 and S = 1 or 4. (C) In experiment II, total biomass (above-ground plus below-ground, 0–20 cm in depth; +1 SE) for plots planted with four functional groups (F = 4) and 4, 9, or 16 species, grown at four combinations of ambient (368 μmol·mol-1) and elevated (560 μmol·mol-1) concentrations of CO2 and ambient N and enriched N (4 g·m-2·year-1). Data were averaged over two harvests in each year from 1998 to 2001. amb, Ambient; elev, elevated; enrich, enriched.
Fig. 2.
Fig. 2.
Effects of F at a standardized S on biomass and biomass responses to elevated CO2 and enriched N. All data were from experiment III. (A) Total biomass (above-ground plus below-ground, 0–20 cm in depth; +1 SE) for plots planted with four species (S = 4) drawn from 1, 2, 3, or 4 functional groups, grown at four combinations of ambient (368 μmol·mol-1) and elevated (560 μmol·mol-1) concentrations of CO2 and ambient N and enriched N (4 g·m-2·year-1). Data were averaged over two harvests in each year from 1998 to 2001. (B) Change in total biomass (compared with ambient levels of both CO2 and N) in response to elevated CO2 alone (at ambient N), to enriched N alone (at ambient CO2), and to the combination of elevated CO2 and enriched N, in each year, for plots with S = 4 and F = 1, 2, 3, or 4. (C) Change in fine-root biomass (compared with ambient levels of both CO2 and N) in response to elevated CO2 alone (at ambient N), to enriched N alone (at ambient CO2), and to the combination of elevated CO2 and enriched N, in each year, for plots with S = 4 and F = 1, 2, 3, or 4. amb, Ambient; elev, elevated; enrich, enriched.

References

    1. Schmid, B., Joshi, J. & Schlapfer, F. (2002) in The Functional Consequences of Biodiversity, eds. Kinzig, A., Pacala, S. & Tilman, D. (Princeton Univ. Press, Princeton).
    1. Loreau, M. & Hector, A. (2001) Nature 412, 72-76. - PubMed
    1. Shaw, M. R., Zavaleta, E. S., Chiariello, N. R., Cleland, E. E., Mooney, H. A. & Field, C. B. (2002) Science 298, 1987-1990. - PubMed
    1. Hebeisen, T., Luscher, A., Zanetti, S., Fischer, B. U., Hartwig, U. A., Frehner, M., Hendrey G. R., Blum, H. & Nosberger, J. (1997) Global Change Biol. 3, 149-160. - PubMed
    1. Wand, S. J., Midgley, G. F., Jones, M. H. & Curtis, P. S. (1999) Global Change Biol. 5, 723-741.

Publication types

LinkOut - more resources