

Microviscometry reveals reduced blood viscosity and altered shear rate and shear stress profiles in microvessels after hemodilution
- PMID: 15220478
- PMCID: PMC454164
- DOI: 10.1073/pnas.0402937101
Microviscometry reveals reduced blood viscosity and altered shear rate and shear stress profiles in microvessels after hemodilution
Erratum in
- Proc Natl Acad Sci U S A. 2004 Sep 28;101(39):14304
Abstract
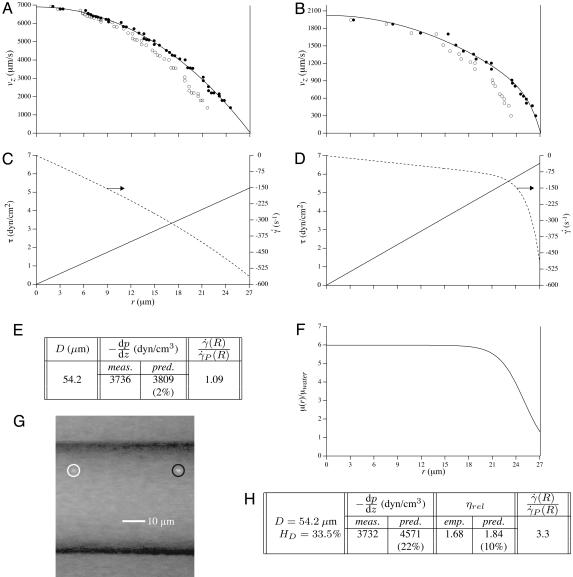
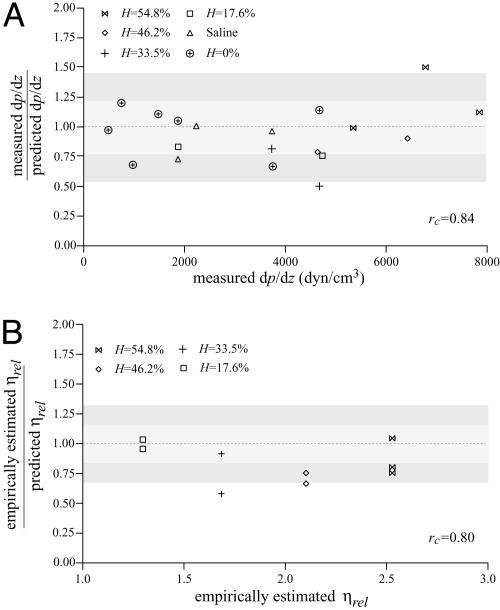
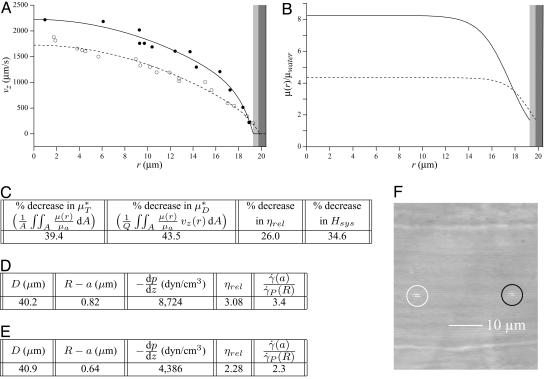
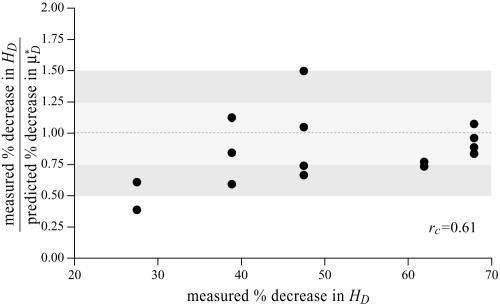
We show that many salient hemodynamic flow properties, which have been difficult or impossible to assess in microvessels in vivo, can be estimated by using microviscometry and fluorescent microparticle image velocimetry in microvessels >20 microm in diameter. Radial distributions in blood viscosity, shear stress, and shear rate are obtained and used to predict axial pressure gradient, apparent viscosity, and endothelial-cell surface-layer thickness in vivo. Based solely on microparticle image velocimetry data, which are readily obtainable during the course of most intravital microscopy protocols from systemically injected particle tracers, we show that the microviscometric method consistently predicted a reduction in local and apparent blood viscosity after isovolemic hemodilution. Among its clinical applications, hemodilution is a procedure that is used to treat various pathologies that require reduction in peripheral vascular-flow resistance. Our results are directly relevant in this context because they suggest that the fractional decrease in systemic hematocrit is approximately 25-35% greater than the accompanying fractional decrease in microvascular-flow resistance in vivo. In terms of its fundamental usefulness, the microviscometric method provides a comprehensive quantitative analysis of microvascular hemodynamics that has applications in broad areas of medicine and physiology and is particularly relevant to quantitative studies of angiogenesis, tumor growth, leukocyte adhesion, vascular-flow resistance, tissue perfusion, and endothelial-cell mechanotransduction.
Figures
Similar articles
-
Microvascular blood viscosity in vivo and the endothelial surface layer.Am J Physiol Heart Circ Physiol. 2005 Dec;289(6):H2657-64. doi: 10.1152/ajpheart.00297.2005. Epub 2005 Jul 22. Am J Physiol Heart Circ Physiol. 2005. PMID: 16040719
-
Plasma expander viscosity effects on red cell-free layer thickness after moderate hemodilution.Biorheology. 2011;48(5):277-91. doi: 10.3233/BIR-2012-0598. Biorheology. 2011. PMID: 22433569
-
Plasma viscosity regulates systemic and microvascular perfusion during acute extreme anemic conditions.Am J Physiol Heart Circ Physiol. 2006 Nov;291(5):H2445-52. doi: 10.1152/ajpheart.00394.2006. Epub 2006 May 26. Am J Physiol Heart Circ Physiol. 2006. PMID: 16731641
-
Hemodilution and blood substitutes.Artif Cells Blood Substit Immobil Biotechnol. 1994;22(2):137-44. doi: 10.3109/10731199409117409. Artif Cells Blood Substit Immobil Biotechnol. 1994. PMID: 8087237 Review.
-
Beneficial effects due to increasing blood and plasma viscosity.Clin Hemorheol Microcirc. 2006;35(1-2):51-7. Clin Hemorheol Microcirc. 2006. PMID: 16899906 Review.
Cited by
-
Microvascular transport and tumor cell adhesion in the microcirculation.Ann Biomed Eng. 2012 Nov;40(11):2442-55. doi: 10.1007/s10439-012-0561-0. Epub 2012 Apr 3. Ann Biomed Eng. 2012. PMID: 22476895 Free PMC article. Review.
-
PEG-albumin supraplasma expansion is due to increased vessel wall shear stress induced by blood viscosity shear thinning.Am J Physiol Heart Circ Physiol. 2012 Jun 15;302(12):H2489-97. doi: 10.1152/ajpheart.01090.2011. Epub 2012 Apr 13. Am J Physiol Heart Circ Physiol. 2012. PMID: 22505638 Free PMC article.
-
Accurate blood flow measurements: are artificial tracers necessary?PLoS One. 2012;7(9):e45247. doi: 10.1371/journal.pone.0045247. Epub 2012 Sep 20. PLoS One. 2012. PMID: 23028878 Free PMC article.
-
Mesoscale simulation of blood flow in small vessels.Biophys J. 2007 Mar 15;92(6):1858-77. doi: 10.1529/biophysj.106.095042. Epub 2007 Jan 5. Biophys J. 2007. PMID: 17208982 Free PMC article.
-
Simulation of Mechanical Heart Valve Dysfunction and the Non-Newtonian Blood Model Approach.Appl Bionics Biomech. 2022 Apr 19;2022:9612296. doi: 10.1155/2022/9612296. eCollection 2022. Appl Bionics Biomech. 2022. Retraction in: Appl Bionics Biomech. 2023 Nov 29;2023:9896350. doi: 10.1155/2023/9896350. PMID: 35498142 Free PMC article. Retracted. Review.
References
-
- Goldsmith, H. L. (1986) Microvasc. Res. 31, 121-142. - PubMed
-
- Cokelet, G. R. (1999) Biorheology 36, 343-358. - PubMed
-
- Pries, A. R., Neuhaus, D. & Gaehtgens, P. (1992) Am. J. Physiol. 263, H1770-H1778. - PubMed
-
- Secomb, T. W., Skalak, R., Özkaya, N. & Gross, J. F. (1986) J. Fluid. Mech. 163, 405-423.
-
- Damiano, E. R. (1998) Microvasc. Res. 55, 77-91. - PubMed
Publication types
MeSH terms
Grants and funding
LinkOut - more resources
Full Text Sources
