

Changes in serial optical topography and TMS during task performance after constraint-induced movement therapy in stroke: a case study
- PMID: 15228805
- PMCID: PMC3572512
- DOI: 10.1177/0888439004265113
Changes in serial optical topography and TMS during task performance after constraint-induced movement therapy in stroke: a case study
Abstract
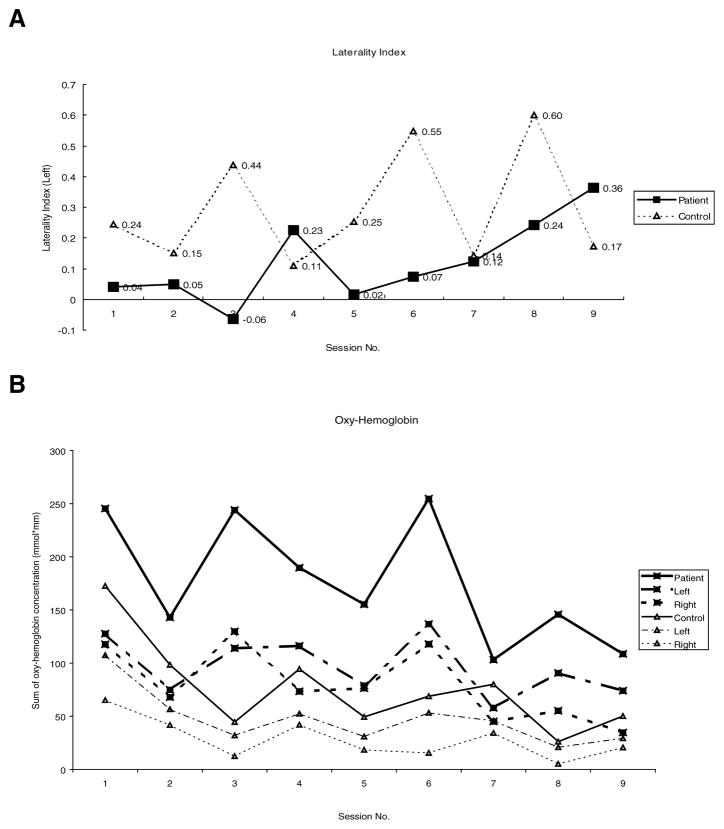
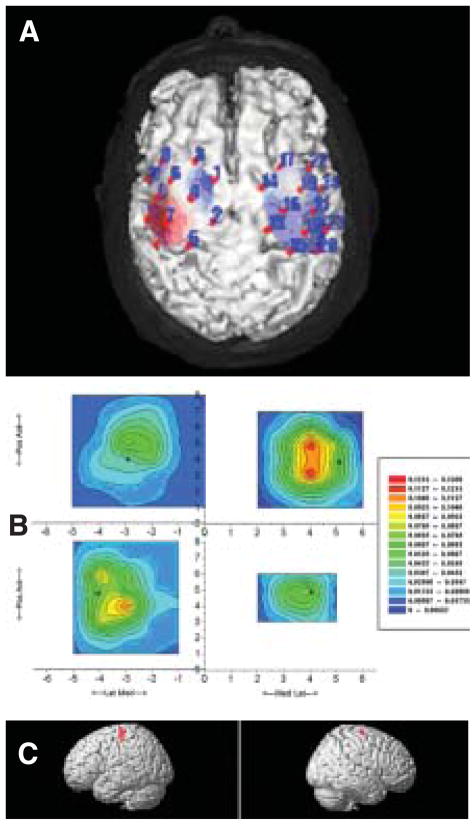
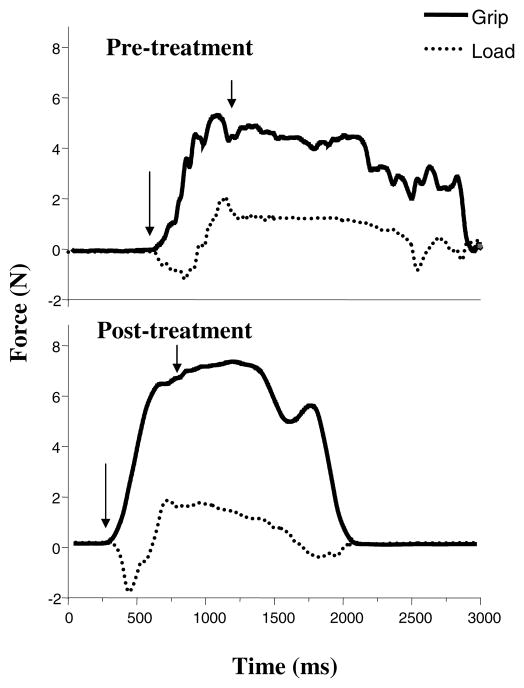
The authors examined serial changes in optical topography in a stroke patient performing a functional task, as well as clinical and physiologic measures while undergoing constraint-induced therapy (CIT). A 73-year-old right hemiparetic patient, who had a subcortical stroke 4 months previously, received 2 weeks of CIT. During the therapy, daily optical topography imaging using near-infrared light was measured serially while the participant performed a functional key-turning task. Clinical outcome measures included the Wolf Motor Function Test (WMFT), Motor Activity Log (MAL), and functional key grip test. Transcranial magnetic stimulation (TMS) and functional magnetic resonance imaging (fMRI) were also used to map cortical areas and hemodynamic brain responses, respectively. Optical topography measurement showed an overall decrease in oxy-hemoglobin concentration in both hemispheres as therapy progressed and the laterality index increased toward the contralateral hemisphere. An increased TMS motor map area was observed in the contralateral cortex following treatment. Posttreatment fMRI showed bilateral primary motor cortex activation, although slightly greater in the contralateral hemisphere, during affected hand movement. Clinical scores revealed marked improvement in functional activities. In one patient who suffered a stroke, 2 weeks of CIT led to improved function and cortical reorganization in the hemisphere contralateral to the affected hand.
Figures
Similar articles
-
Mental practice with motor imagery: evidence for motor recovery and cortical reorganization after stroke.Arch Phys Med Rehabil. 2006 Dec;87(12 Suppl 2):S2-11. doi: 10.1016/j.apmr.2006.08.326. Arch Phys Med Rehabil. 2006. PMID: 17140874 Free PMC article. Clinical Trial.
-
Alterations in cortical excitability in chronic stroke after constraint-induced movement therapy.Neurol Res. 2008 Jun;30(5):504-10. doi: 10.1179/016164107X252519. Neurol Res. 2008. PMID: 18953741 Clinical Trial.
-
Motor recovery and cortical reorganization after constraint-induced movement therapy in stroke patients: a preliminary study.Neurorehabil Neural Repair. 2002 Dec;16(4):326-38. doi: 10.1177/154596830201600403. Neurorehabil Neural Repair. 2002. PMID: 12462764 Clinical Trial.
-
Brain plasticity and rehabilitation in stroke patients.J Nippon Med Sch. 2015;82(1):4-13. doi: 10.1272/jnms.82.4. J Nippon Med Sch. 2015. PMID: 25797869 Review.
-
Neuroimaging experimental studies on brain plasticity in recovery from stroke.Eura Medicophys. 2007 Jun;43(2):241-54. Eura Medicophys. 2007. PMID: 17589415 Review.
Cited by
-
A Systemic Review of Functional Near-Infrared Spectroscopy for Stroke: Current Application and Future Directions.Front Neurol. 2019 Feb 5;10:58. doi: 10.3389/fneur.2019.00058. eCollection 2019. Front Neurol. 2019. PMID: 30804877 Free PMC article.
-
Constraint-induced movement therapy after stroke.Lancet Neurol. 2015 Feb;14(2):224-34. doi: 10.1016/S1474-4422(14)70160-7. Lancet Neurol. 2015. PMID: 25772900 Free PMC article. Review.
-
Skilled Bimanual Training Drives Motor Cortex Plasticity in Children With Unilateral Cerebral Palsy.Neurorehabil Neural Repair. 2016 Oct;30(9):834-44. doi: 10.1177/1545968315625838. Epub 2016 Feb 11. Neurorehabil Neural Repair. 2016. PMID: 26867559 Free PMC article. Clinical Trial.
-
Post-stroke motor recovery and cortical organization following Constraint-Induced Movement Therapies: a literature review.J Phys Ther Sci. 2019 Nov;31(11):950-959. doi: 10.1589/jpts.31.950. Epub 2019 Nov 26. J Phys Ther Sci. 2019. PMID: 31871384 Free PMC article.
-
A Systematic Review of Integrated Functional Near-Infrared Spectroscopy (fNIRS) and Transcranial Magnetic Stimulation (TMS) Studies.Front Neurosci. 2019 Feb 28;13:84. doi: 10.3389/fnins.2019.00084. eCollection 2019. Front Neurosci. 2019. PMID: 30872985 Free PMC article.
References
-
- Duncan P. Synthesis of intervention trials to improve motor recovery following stroke. Top Stroke Rehabil. 1997;3:1–20. - PubMed
-
- Taub E, Uswatte G, Elbert T. New treatments in neurorehabilitation founded on basic research. Nat Rev Neurosci. 2002;3:228–36. - PubMed
-
- Taub E, Wolf S. Constraint induced movement techniques to facilitate upper extremity use in stroke patients. Top Stroke Rehabil. 1997;3:38–62. - PubMed
-
- Winstein CJ, Wing AM, Whitall J. Motor control and learning principles for rehabilitation of upper limb movements after brain injury. In: Grafman J, Robertson I, editors. Plasticity and rehabilitation. 2. Vol. 9. Amsterdam: Elsevier Science BV; 2003. pp. 77–137.
-
- Wolf SL. From tibialis anterior to Tai Chi: biofeedback and beyond. Appl Psychophysiol Biofeedback. 2001;26:155–74. - PubMed
Publication types
MeSH terms
Grants and funding
LinkOut - more resources
Full Text Sources
Medical
Research Materials
