. 2004 Jun 30;24(26):6011-20.
doi: 10.1523/JNEUROSCI.1389-04.2004.

Whisker vibration information carried by rat barrel cortex neurons

Affiliations

Whisker vibration information carried by rat barrel cortex neurons

Ehsan Arabzadeh et al. J Neurosci. .

Abstract

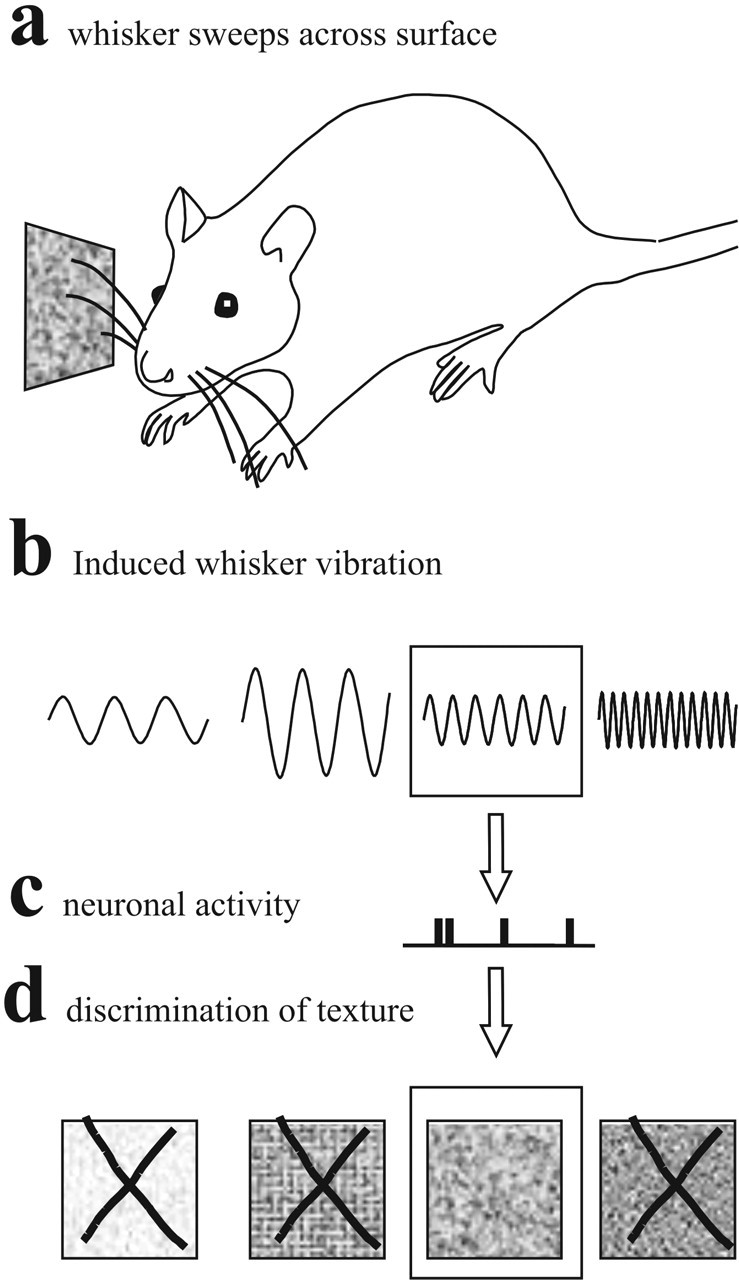
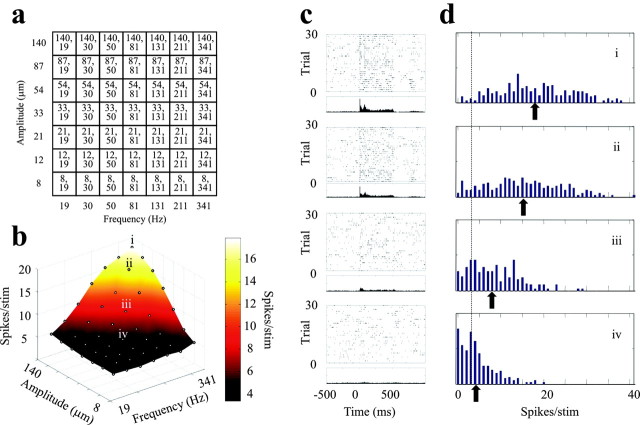
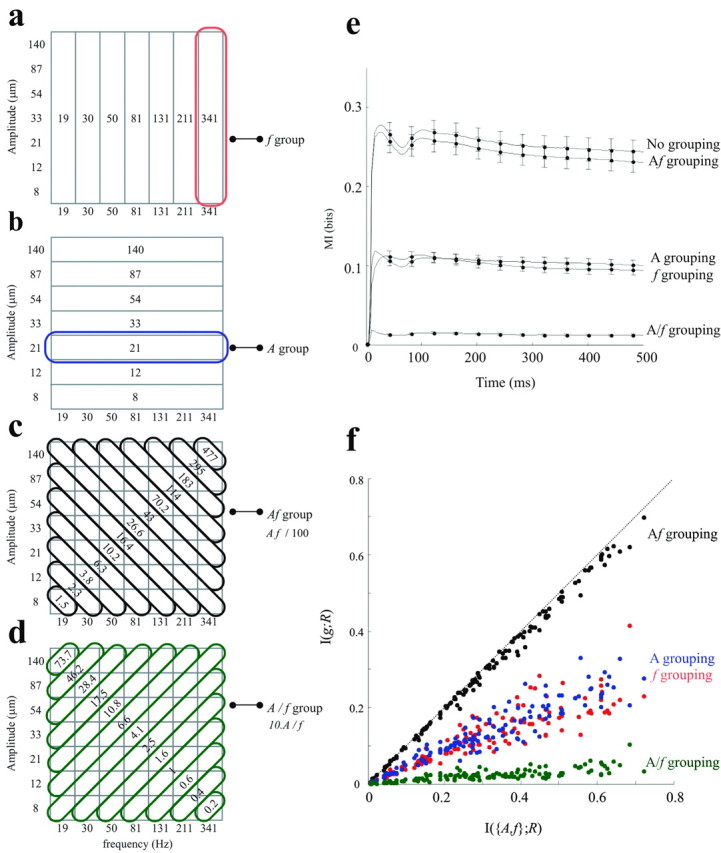
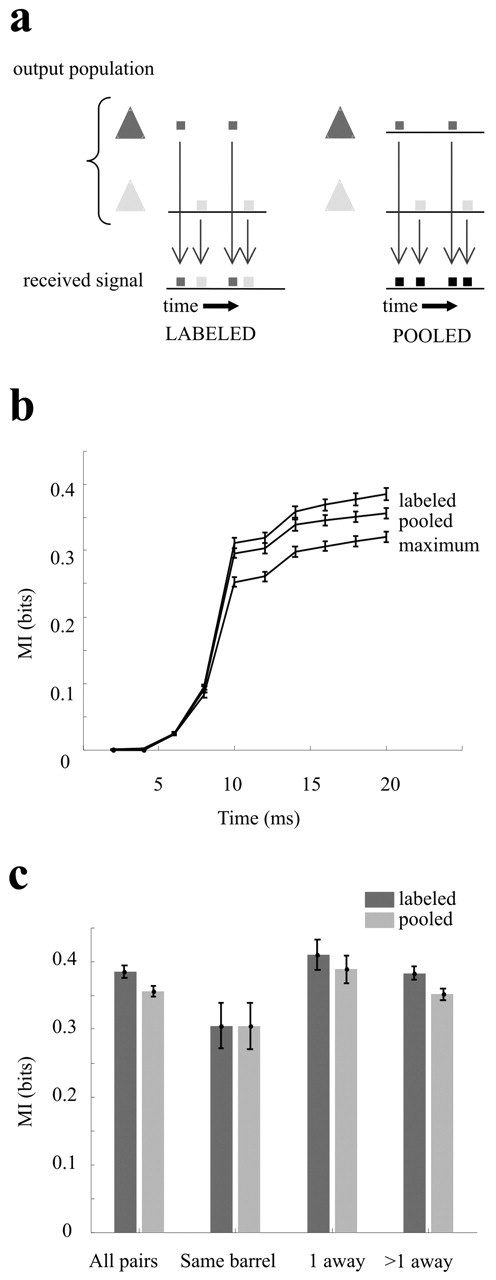
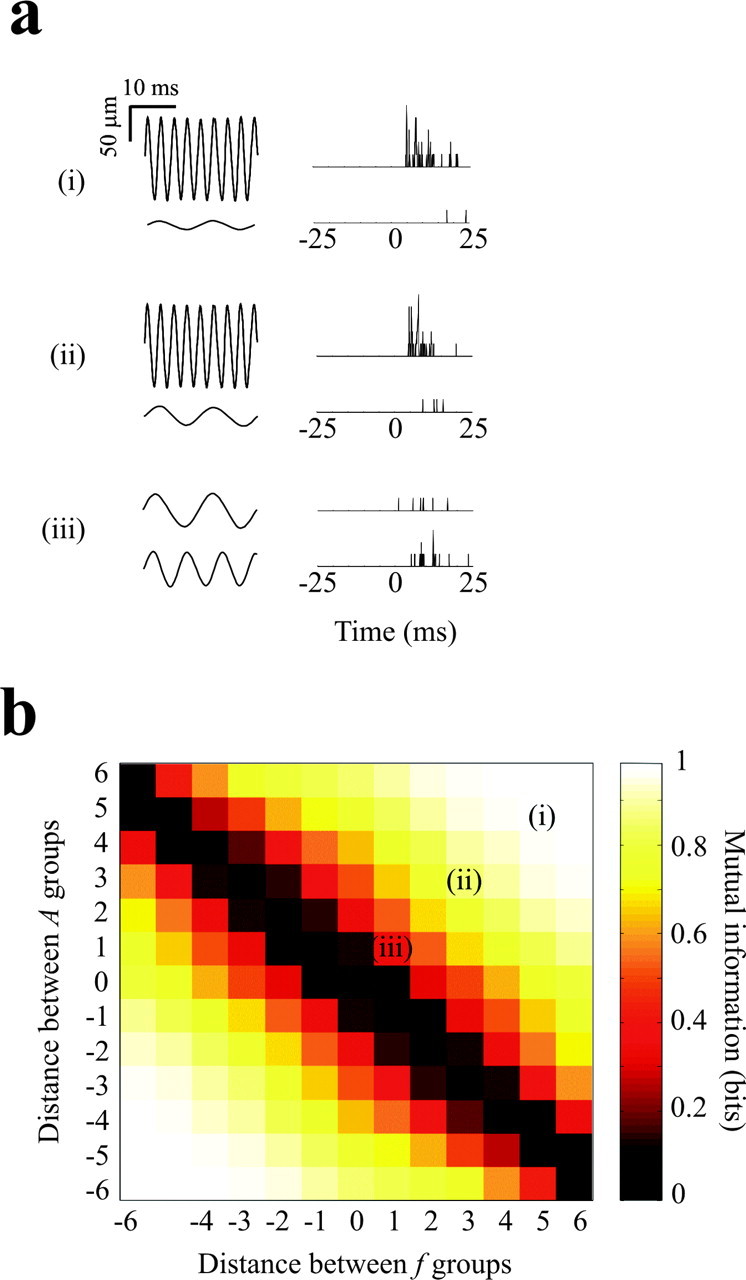
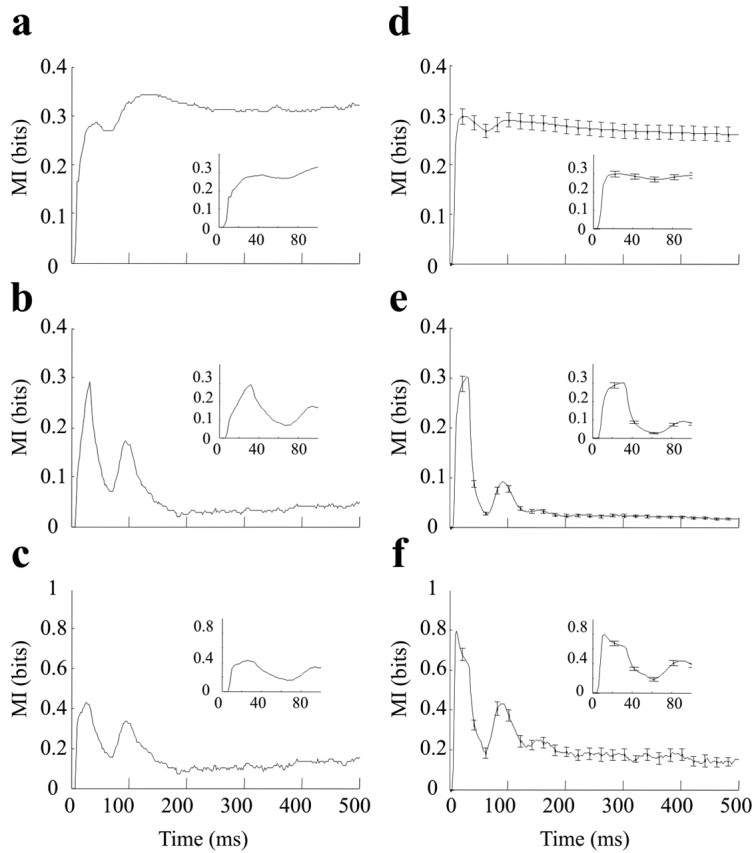
Rats can make extremely fine texture discriminations by "whisking" their vibrissa across the surface of an object. We have investigated one hypothesis for the neuronal basis of texture representation by measuring how clusters of neurons in the barrel cortex of anesthetized rats encode the kinetic features of sinusoidal whisker vibrations. Mutual information analyses of spike counts led to a number of findings. Information about vibration kinetics became available as early as 6 msec after stimulus onset and reached a peak at approximately 20-30 msec. Vibration speed, proportional to the product of vibration amplitude (A) and frequency (f), was the kinetic property most reliably reported by cortical neurons. Indeed, by measuring information when the complete stimulus set was collapsed into feature-defined groups, we found that neurons reduced the dimensionality of the stimulus from two features (A, f) to a single feature, the product Af. Moreover, because different neurons encode stimuli in the same manner, information loss was negligible even when the activity of separate neuronal clusters was pooled. This suggests a decoding scheme whereby target neurons could capture all available information simply by summating the signals from separate barrel cortex neurons. These results indicate that neuronal population activity provides sufficient information to allow nearly perfect discrimination of two vibrations, based on their deflection speeds, within a time scale comparable with that of a single whisking motion across a surface.


Figures

Figure 1.
Figure 1.
Schematic model for texture discrimination based on the proposal that the kinetic “signature” of whisker vibrations is encoded by neurons. In this scheme, vibrations take the simplest possible form, sinusoidal waveforms. See Introduction for details.
Figure 2.
Figure 2.
Stimulus set and the characteristics of neuronal responses. a, The combination of seven frequencies (horizontal axis of grid) and seven amplitudes (vertical axis of grid) yielded the stimulus set of 49 sinusoidal vibrations. The numbers given in each element of the grid are the amplitude, frequency. b, Spike counts for each stimulus over the 0-500 msec time window (vibration onset, 0 msec) averaged over 200 trials for a neuronal cluster in barrel column D2, experiment 1. Because the frequency and amplitude scales are logarithmic, points are spaced evenly along the frequency and amplitude axes. c, Raster plots and PSTHs for the stimuli denoted i-iv in b. Dots in the top parts show spike times across 30 trials; the 200-trial PSTH (bin size, 5 msec) is aligned below the raster plot. Stimulus presentation is from 0 to 500 msec. d, Distribution of spike counts (0-500 msec) across 200 stimuli for the same four stimuli. The dotted line shows the average spontaneous activity (7 spikes/500 msec) for this neuronal cluster, and the arrows mark the average spike counts for each stimulus. Note how widely the trial-by-trial spike counts varied around the mean.
Figure 4.
Figure 4.
Stimulus grouping rules and their effect on information transmission. a-d, Four different stimulus grouping rules. a, Stimuli grouped into seven vertical iso-frequency bands. For the information analysis, all vibrations possessing the same frequency value were considered to be the same stimulus. The defining value is given within the band. b, Stimuli grouped into seven horizontal iso-amplitude bands. c, Stimuli grouped into 13 diagonal iso-speed bands. Within each band, the value of the product Af is given. d, Stimuli grouped into 13 diagonal A/f bands; orthogonal grouping. e, Cumulative information about the stimulus set grouped according to the features f, A, Af, and A/f plotted against the upper limit, the information about the entire set of 49 stimuli (no grouping). The data with no grouping are carried over from Figure 3d. Each curve represents the average from 130 neuronal clusters recorded in experiments 1-5. Error bars are the SEs of the mean across clusters. f, The effect of stimulus grouping on each neuronal cluster. For each neuronal cluster, the quantity of information transmitted was taken to be the maximum value of cumulative information curve. The x-axis denotes the information carried about the full stimulus set, and the y-axis denotes the information for the same neuronal cluster when stimuli were grouped according to a selected rule.
Figure 5.
Figure 5.
Information available based on labeled-line versus pooled decoding models. a, Schematic representation of the two decoding models. Two neurons (light and dark gray pyramids) emit spike trains. The target neurons may integrate each spike separately and conserve the label of the source neuron (left) or may pool the incoming spikes without conserving the label (right). b, Cumulative information curves averaged over all pairs (n = 276) of neuronal clusters in experiment 1. Error bars are SEM mutual information across pairs. c, Effect of relative positions of the same 276 pairs of neuronal clusters on their pooled and labeled-line information. Neuronal response is defined as spike counts in 0-20 msec after stimulus onset.
Figure 6.
Figure 6.
Discriminability between pairs of stimuli. a, Three pairs of sinusoidal vibrations and associated single-trial neuronal responses. Each response is the result of pooling the activity across all 37 electrodes in experiment 3. Illustrated responses were selected randomly from the 150 trials for each stimulus. b, Information carried about pairs of stimuli. To make the graph, all stimulus pairs were classified according to f1-f2 and A1-A2, in which the frequency and amplitude distances refer to steps along the selected dimension (see Fig. 4a,b). The color of each element in the graph gives the average information about all stimulus pairs with the indicated values of f1-f2 and A1-A2. Information is measured from the whole-array pooled spike count in the interval 0-25 msec after stimulus onset.
Figure 3.
Figure 3.
Time course of information of ∼49 stimuli carried by a single neuronal cluster (left) and by all clusters (right). a, Cumulative information: spike counts measured from stimulus onset until the time indicated on the x-axis. b, Ongoing information: spike counts measured in the 25 msec time window preceding the time indicated on the x-axis. c, Information per spike, calculated by dividing ongoing information (b) by the average number of spikes in each time window. d-f, The same plots in a-c averaged over all 130 neuronal clusters recorded in experiments 1-5. In all plots, the inset is a magnified view of the earliest part of the curve (0-100 msec).

Similar articles

Cited by

References

    1. Adelman TL, Bialek W, Olberg RM (2003) The information content of receptive fields. Neuron 40: 823-833. - PubMed
    1. Arabzadeh E, Petersen RS, Diamond ME (2003) Encoding of whisker vibration by rat barrel cortex neurons: implications for texture discrimination. J Neurosci 23: 9146-9154. - PMC - PubMed
    1. Blake DT, Hsiao SS, Johnson KO (1997) Neural coding mechanisms in tactile pattern recognition: the relative contributions of slowly and rapidly adapting mechanoreceptors to perceived roughness. J Neurosci 17: 7480-7489. - PMC - PubMed
    1. Borst A, Theunissen FE (1999) Information theory and neural coding. Nat Neurosci 2: 947-957. - PubMed
    1. Brecht M, Preilowski B, Merzenich MM (1997) Functional architecture of the mystacial vibrissae. Behav Brain Res 84: 81-97. - PubMed

Publication types

LinkOut - more resources