. 2004 Jun 30;24(26):6028-36.
doi: 10.1523/JNEUROSCI.0713-04.2004.

Structural abnormalities in the brains of human subjects who use methamphetamine

Affiliations

Structural abnormalities in the brains of human subjects who use methamphetamine

Paul M Thompson et al. J Neurosci. .

Abstract

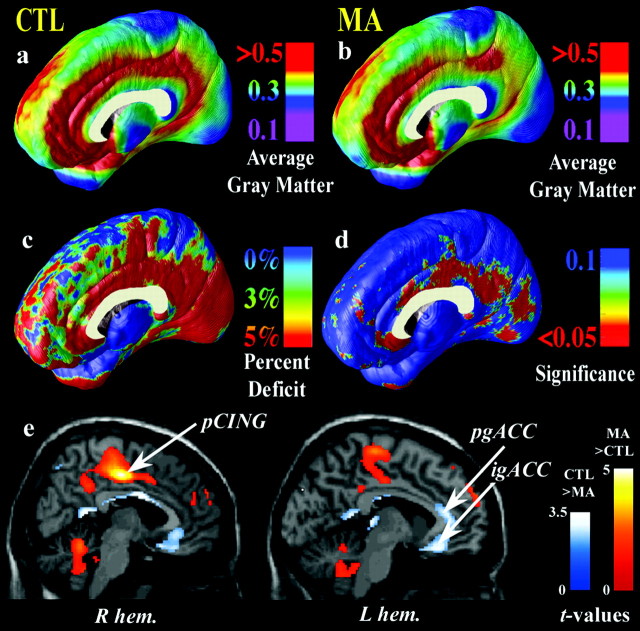
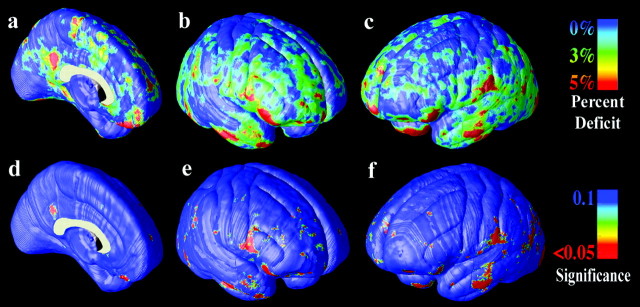
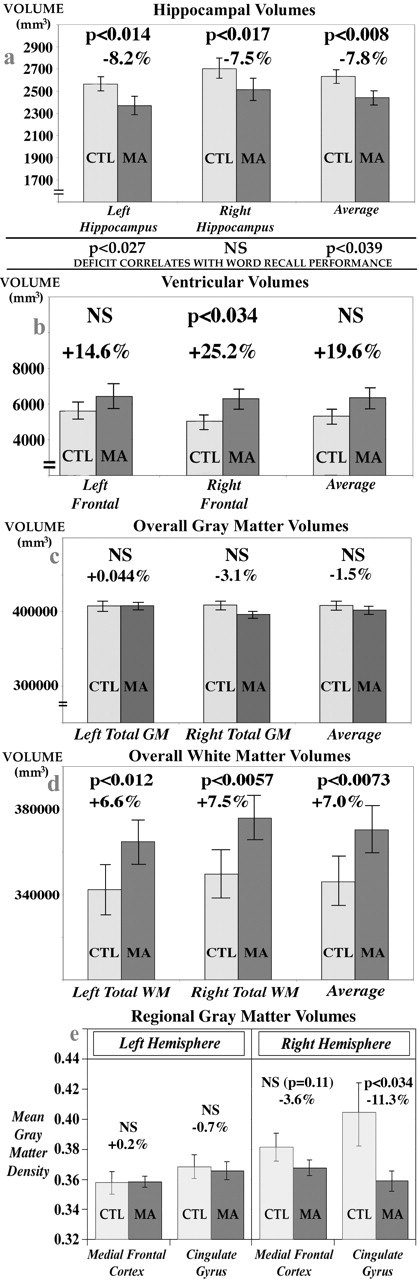
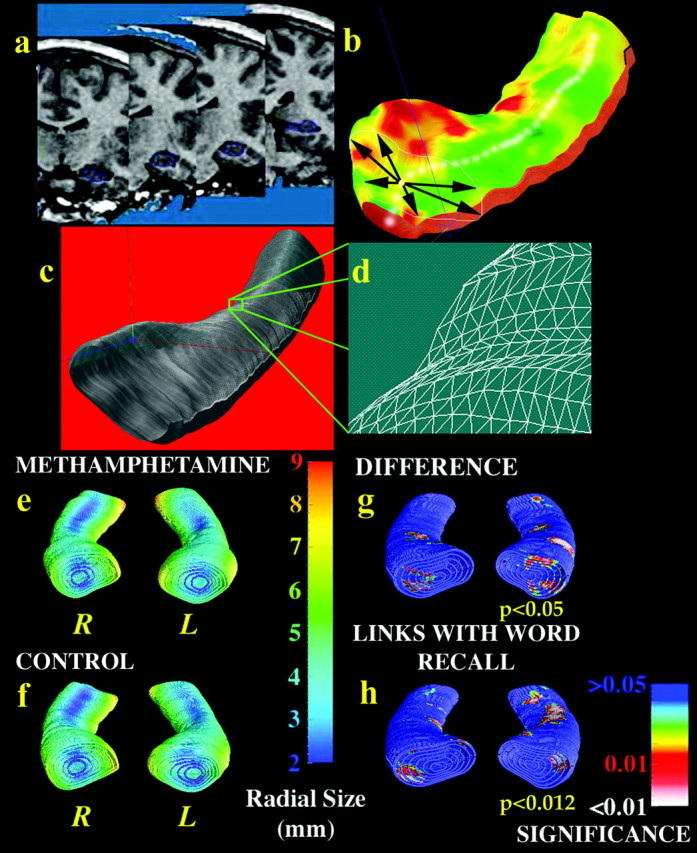
We visualize, for the first time, the profile of structural deficits in the human brain associated with chronic methamphetamine (MA) abuse. Studies of human subjects who have used MA chronically have revealed deficits in dopaminergic and serotonergic systems and cerebral metabolic abnormalities. Using magnetic resonance imaging (MRI) and new computational brain-mapping techniques, we determined the pattern of structural brain alterations associated with chronic MA abuse in human subjects and related these deficits to cognitive impairment. We used high-resolution MRI and surface-based computational image analyses to map regional abnormalities in the cortex, hippocampus, white matter, and ventricles in 22 human subjects who used MA and 21 age-matched, healthy controls. Cortical maps revealed severe gray-matter deficits in the cingulate, limbic, and paralimbic cortices of MA abusers (averaging 11.3% below control; p < 0.05). On average, MA abusers had 7.8% smaller hippocampal volumes than control subjects (p < 0.01; left, p = 0.01; right, p < 0.05) and significant white-matter hypertrophy (7.0%; p < 0.01). Hippocampal deficits were mapped and correlated with memory performance on a word-recall test (p < 0.05). MRI-based maps suggest that chronic methamphetamine abuse causes a selective pattern of cerebral deterioration that contributes to impaired memory performance. MA may selectively damage the medial temporal lobe and, consistent with metabolic studies, the cingulate-limbic cortex, inducing neuroadaptation, neuropil reduction, or cell death. Prominent white-matter hypertrophy may result from altered myelination and adaptive glial changes, including gliosis secondary to neuronal damage. These brain substrates may help account for the symptoms of MA abuse, providing therapeutic targets for drug-induced brain injury.


Figures

Figure 1.
Figure 1.
Gray-matter differences on the medial brain surface. Group difference maps (c) show mean percentage differences in gray-matter volumes between the control group average (a) and the methamphetamine group average (b), according to the color bar. The significance of these reductions is plotted in d as a map of p values. The cingulate gyrus shows highly significant gray-matter deficits (red colors; p < 0.034, corrected), whereas other brain regions are comparatively spared (blue colors). e is from London et al. (2004) (reprinted with permission). It shows the locations of MA (n = 17) and control (n = 18) group differences in relative regional cerebral metabolic glucose rate, assessed with PET. This PET sample partially overlaps with the current sample assessed with MRI. Briefly, in e, statistical parametric maps reveal regions in which the MA group has greater (red colors) or lesser (blue colors) glucose metabolism. Colors superimposed on a gray-scale MRI template indicate areas in which the significance of the group difference was t ≥ 1.69 (p = 0.049). The region of greatest gray-matter deficit (b, d) is in the right hemisphere posterior cingulate cortex (pCING), and so is the region of greatest metabolic increase in the MA group (e). This suggests an anatomical congruence of the MRI-based deficits with metabolic differences observed with PET. igACC and pgACC denote the inferior and perigenual anterior cingulate cortex, respectively. CTL, Control; R hem, right hemisphere; L hem, left hemisphere.
Figure 2.
Figure 2.
Gray-matter differences on the lateral brain surfaces. The mean reduction in gray matter in the MA group, relative to healthy controls, is expressed as a percentage and shown color-coded (blue colors, no reduction; red colors, greater reduction). In the left medial wall (a) and right-lateral (b) and left-lateral (c) brain surfaces, gray-matter differences are not pronounced. The significance of these differences is plotted in d-f. Differences were not significant after correction for multiple comparisons.
Figure 3.
Figure 3.
Comparison of brain structure volumes in MA abusers and healthy controls (CTL). Means and SE measures (error bars) are shown for the volumes of the hippocampus (a), frontal horn of the lateral ventricles (b), total cerebral gray matter (GM) (c), and total cerebral white matter (WM) (d). MA abusers show reductions in hippocampal volumes without significant reductions in gray-matter volume overall (c). They also show volume expansions in some ventricular regions (b) and increases in white-matter volume (d). e shows that mean gray-matter density in the cingulate gyrus is reduced in MA abusers (by 11.3%; p < 0.034), erasing the normal right > left asymmetry in gray-matter density that is found here and has been documented previously in healthy subjects. In agreement with the maps, this deficit pattern is not found in the adjacent medial frontal cortex.
Figure 4.
Figure 4.
Hippocampal atrophy in MA abusers is linked with poorer memory performance. Each individual's hippocampus is traced in coronal MRI sections (a) and converted to a mesh surface representation (b) in which the radial size of the hippocampus is measured from a centerline and plotted in color on the surface to index radial atrophy. Arrows in b represent vectors from the centerline to various points on the hippocampal surface. These meshes are averaged across subjects (c), and atrophy relative to the control mean is computed at each surface grid point (d). Shown in millimeters in e and f, the average radial size of the hippocampus in MA abusers (e) is smaller in some regions [red colors in g] than corresponding regions in healthy controls (f). h shows hippocampal regions (in red colors) in which word-recall performance is significantly linked with radial atrophy.

Similar articles

Cited by

References

    1. Ashburner J, Friston KJ (1999) Nonlinear spatial normalization using basis functions. Hum Brain Mapp 7: 254-266. - PMC - PubMed
    1. Ashburner J, Friston KJ (2000) Voxel-based morphometry-the methods [review]. NeuroImage 11: 805-821. - PubMed
    1. Bartzokis G, Beckson M, Lu PH, Nuechterlein KH, Edwards N, Mintz J (2001) Age-related changes in frontal and temporal lobe volumes in men: a magnetic resonance imaging study. Arch Gen Psychiatry 58: 461-465. - PubMed
    1. Bartzokis G, Cummings JL, Sultzer D, Henderson VW, Nuechterlein KH, Mintz J (2003) White matter structural integrity in healthy aging adults and patients with Alzheimer disease: a magnetic resonance imaging study. Arch Neurol 60: 393-398. - PubMed
    1. Beck AT, Steer RA (1987) Manual for the Revised Beck Depression Inventory. San Antonio, TX: Psychological Corp.

Publication types

MeSH terms

Substances