. 2004 Sep;15(9):4031-42.
doi: 10.1091/mbc.e03-05-0271. Epub 2004 Jun 30.

PrP(C) association with lipid rafts in the early secretory pathway stabilizes its cellular conformation

Affiliations

PrP(C) association with lipid rafts in the early secretory pathway stabilizes its cellular conformation

Daniela Sarnataro et al. Mol Biol Cell. 2004 Sep.

Abstract

The pathological conversion of cellular prion protein (PrP(C)) into the scrapie prion protein (PrP(Sc)) isoform appears to have a central role in the pathogenesis of transmissible spongiform encephalopathies. However, the identity of the intracellular compartment where this conversion occurs is unknown. Several lines of evidence indicate that detergent-resistant membrane domains (DRMs or rafts) could be involved in this process. We have characterized the association of PrP(C) to rafts during its biosynthesis. We found that PrP(C) associates with rafts already as an immature precursor in the endoplasmic reticulum. Interestingly, compared with the mature protein, the immature diglycosylated form has a different susceptibility to cholesterol depletion vs. sphingolipid depletion, suggesting that the two forms associate with different lipid domains. We also found that cholesterol depletion, which affects raft-association of the immature protein, slows down protein maturation and leads to protein misfolding. On the contrary, sphingolipid depletion does not have any effect on the kinetics of protein maturation or on the conformation of the protein. These data indicate that the early association of PrP(C) with cholesterol-enriched rafts facilitates its correct folding and reinforce the hypothesis that cholesterol and sphingolipids have different roles in PrP metabolism.


Figures

Figure 2.
Figure 2.
Association of PrPC with DRMs in the early secretory pathway. FRT cells grown on 100-mm dishes (3 dishes for each chase time) were pulsed for 20 min with [35S]methionine and then chased for the indicated times. The cells were lysed in TNE/TX-100 1% buffer and then run through a linear 5-40% sucrose gradient. One-milliliter fractions were collected from the top to bottom of the tube after centrifugation to equilibrium, and PrPC was immunoprecipitated from all fractions with SAF 32 antibody and subjected to SDS-PAGE and phosphorimager scanning (left panel). The amount of PrPC in each fraction was quantified by scanning three independent gels using the NIH image software for Macintosh and is represented in right panel as percentage of the total amount of the protein (gray bars indicate the amount of floating PrPC, fractions 1-7; black bars indicate the amount of soluble PrPC, fractions 8-12). Endo-H treatment (Thotakura and Bahl, 1987), performed after every chase time on an aliquot of the sample before running the sucrose gradient, is shown in the middle panel. Error bars are indicated. H, mature, highly glycosylated PrPC isoform; I*, unmodified diglycosylated isoform; IΔ, monoglycosylated form; U, unglycosylated form. Raft fractions are identified by the GM1 profile on sucrose density gradient, shown at the bottom of the picture.
Figure 4.
Figure 4.
Pulse-chase analysis of PrPC after cholesterol and sphingolipid depletion. FRT cells grown in control (control), cholesterol depletion (Mev/βCD), and sphingolipid depletion (FB1) conditions (see Materials and Methods) were subjected to pulse-chase analysis by using [35S]methionine for the indicated times. At the end of each chase time the cells were lysed in Triton/Doc buffer and PrPC was immunoprecipitated with SAF 32 antibody. The immunoprecipitated material was treated (+) or not (-) with Endo-H (5 mU/sample for 16 h at 37°C). The protein was revealed by SDS-PAGE and phosphorimager scanning. Quantitation of four independent experiments are shown in the graphs in the right panels. Error bars are reported from the different quantitations. H, mature, highly glycosylated PrPC isoform; I*, unmodified diglycosylated isoform; IΔ, monoglycosylated form; U, unglycosylated form.
Figure 3.
Figure 3.
Analysis of PrPC in DRMs from purified ER membranes. (A) ER microsomes were purified from FRT cells grown on 150-mm dishes as described in Materials and Methods. Fifty or 100 μg of proteins in the cell homogenate and in the microsomal fraction were TCA precipitated, subjected to SDS-PAGE, and blotted using anti-EEA1, -GM130, -CNX, -PDI, -BiP, and -RibI antibodies. PrPC was revealed after immunoprecipitation with SAF 32 antibody by phosphorimager scanning from 300 μg of ER microsomes isolated as above after a 20-min pulse with [35S]methionine. (B) ER microsomes obtained after pulse-labeling the cells for 20 min with [35S]methionine were lysed in cold TNE/TX-100 1% buffer and the run through a discontinuous 5-40% sucrose density gradient. The collected fractions were immunoprecipitated with SAF 32, loaded on 12% gel, and revealed by phophorimager scanning. The flotation profile of RibI by western blot of TCA-precipitated fractions of a sucrose density gradient of ER microsomes is shown below. (C) Flotation profile of different intracellular markers, e.g., EEA1, GM130, RibI, and GM1 from the total cellular lysate in TNE/TX-100 1% is shown for comparison.
Figure 1.
Figure 1.
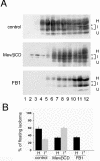
Effect of cholesterol and sphingolipid depletion on PrPC association with DRMs. (A) FRT cells were grown to confluence on 100-mm dishes and treated or not (control) with mevinolin and β-cyclodextrin (Mev/βCD) or fumonisin B1 (FB1) as previously described (Taraboulos et al., 1995; Keller and Simons, 1998; Naslavsky et al., 1999). The cells were lysed for 20 min in cold TNE/TX-100 buffer and then run through a discontinuous 5-40% sucrose gradient. One-milliliter fractions (12 fractions in total) were collected from the top to bottom of the tube after centrifugation to equilibrium, and PrPC was TCA precipitated from all fractions, loaded on 12% gels, and revealed by Western blotting with a specific antibody and ECL. (B) The data from four independent experiments were quantified using NIH image for Macintosh and plotted as shown in the graphs. The amount of PrP present in each fraction of the gradients is considered as percentage of the total amount of the protein in all fractions. In the graph is reported only the floating amount of H and I* PrP isoforms (fractions 1-7 of the gradients). Error bars are indicated. H, mature, highly glycosylated PrPC isoform; I*, unmodified diglycosylated isoform; IΔ, monoglycosylated form; U, unglycosylated form (Capellari et al., 1999; Sarnataro et al., 2002).
Figure 5.
Figure 5.
Analysis of PrPC interaction with ER chaperones. FRT cells were plated in 35-mm dishes in control (-), cholesterol depletion (Mev/βCD +), or sphingolipid depletion (FB1 +) conditions. The cells were then lysed in JS buffer and BiP, PDI, CNX, and CLT were immunoprecipitated (IP) in nondenaturing conditions with the specific antibodies (see Materials and Methods). The immunoprecipitates and 1/10 of the supernatants (Sup) were loaded on polyacrylamide gels. The gels were revealed for the presence of PrPC by Western blotting with the specific antibody (WB:α-PrP) by ECL.
Figure 6.
Figure 6.
Analysis of PrPC misfolding in FRT cells. FRT cells were grown in 35-mm dishes in control (control), cholesterol (Mev/βCD), or sphingolipid (FB1) depletion conditions. The cells were lysed in Triton/Doc buffer, in the absence of proteases inhibitors, and where indicated were treated with PK (3.3 μg/ml) for 2 or 10 min (A) or centrifuged in a TLA 100.3 rotor at 265,000 × g and separated into soluble (S) and insoluble (P) materials (B). In both cases PrPC was revealed by Western blotting by using specific antibodies and ECL. The data were also quantified using the NIH image program for Macintosh and plotted as indicated in the graphs on the right panels. Error bars are indicated.
Figure 7.
Figure 7.
Analysis of PrPC localization and folding after BFA treatment. (A) Cells were plated on coverslips, in control condition (control) or were treated with BFA (1 μg/ml for 1 h), and then they were subjected to indirect immunofluorescence analysis with anti-PrP, anti-giantin, or anti-CLT antibodies. Secondary antibodies against PrP were TRITC-conjugated, whereas secondary antibodies against giantin and CLT were FITC-conjugated. The images were analyzed by confocal microscopy. (B) Confluent cells on 35-mm dishes were treated for 1 h with different BFA concentrations (0, 1, 10 μg/ml, as indicated) lysed in Triton/Doc and the postnuclear supernatant was treated (+) or not (-) with PK (3.3 μg/ml, 2 min 37°C). PrPC was revealed by Western blotting with PRI 308 antibody and ECL. (C) Control (0) and BFA (1, 10) treated cells were lysed in JS buffer and CNX, CLT, BiP, and PDI were immunoprecipitated (IP) in nondenaturing conditions with the specific antibodies (see Materials and Methods). The immunoprecipitates and 1/10 of the supernatants (Sup) were loaded on polyacrylamide gels. The gels were revealed for the presence of PrPC in the ER chaperone immunoprecipitated by Western blotting with the antibody against PrP (WB:α-PrP) and ECL analysis.
Figure 8.
Figure 8.
Analysis of the intracellular site of PrPC misfolding after cholesterol depletion. (A) FRT cells transfected with PrPC were subjected to cell fractionation in control (control) and cholesterol depletion conditions (Mev/βCD) as described in Materials and Methods. The distribution of ER and Golgi markers and PrPC along the gradient was analyzed. Each fraction was TCA precipitated, run on 12% polyacrylamide gels and analyzed by Western blot and ECL with the antibodies against specific ER and Golgi marker proteins (RibI and GM130) and against PrP. The sucrose concentration in the gradient is indicated with open circles. Gels are shown in the bottom panels, whereas quantitations (RibI, squares; GM130, rhombs; and PrP, filled circles) are shown in top panels. (B) Pooled ER-enriched (1, 2, 3) and Golgi-enriched (5, 6, 7) fractions of the gradients showed in panel A were subjected to PK treatment as previously described. Note that PK-resistant bands are found only in the ER-enriched fractions after cholesterol depletion.

Similar articles

Cited by

References

    1. Bartlett, S.E., Reynolds, A.J., Weible, M., 2nd, Noakes, P.G., and Hendry, I.A. (2001). Transport of endosomal early antigen 1 in the rat sciatic nerve and location in cultured neurons. Neuroreport 12, 281-284. - PubMed
    1. Beranger, F., Mange, A., Goud, B., and Lehmann, S. (2002). Stimulation of PrP(C) retrograde transport toward the endoplasmic reticulum increases accumulation of PrP(Sc) in prion-infected cells. J. Biol. Chem. 277, 38972-38977. - PubMed
    1. Bogdanov, M., and Dowhan, W. (1999). Lipid-assisted protein folding. J. Biol. Chem. 274, 36827-36830. - PubMed
    1. Borchelt, D.R., Scott, M., Taraboulos, A., Stahl, N., and Prusiner, S.B. (1990). Scrapie and cellular prion protein differ in their kinetics of synthesis and topology in cultured cells. J. Cell Biol. 110, 743-752. - PMC - PubMed
    1. Borchelt, D.R., Taraboulos, A., and Prusiner, S.B. (1992). Evidence for synthesis of scrapie prion proteins in the endocytic pathway. J. Biol. Chem. 267, 16188-16199. - PubMed

Publication types