

Multi-dimensional time-correlated single photon counting (TCSPC) fluorescence lifetime imaging microscopy (FLIM) to detect FRET in cells
- PMID: 15230870
- PMCID: PMC1903372
- DOI: 10.1111/j.0022-2720.2004.01343.x
Multi-dimensional time-correlated single photon counting (TCSPC) fluorescence lifetime imaging microscopy (FLIM) to detect FRET in cells
Abstract
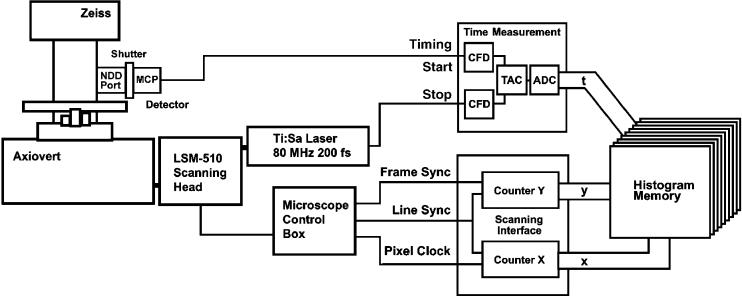
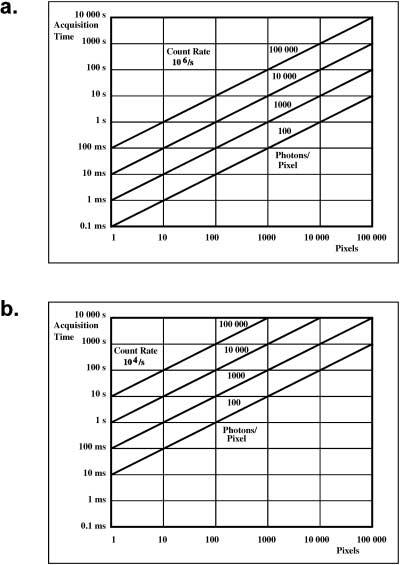
We present a novel, multi-dimensional, time-correlated single photon counting (TCSPC) technique to perform fluorescence lifetime imaging with a laser-scanning microscope operated at a pixel dwell-time in the microsecond range. The unsurpassed temporal accuracy of this approach combined with a high detection efficiency was applied to measure the fluorescent lifetimes of enhanced cyan fluorescent protein (ECFP) in isolation and in tandem with EYFP (enhanced yellow fluorescent protein). This technique enables multi-exponential decay analysis in a scanning microscope with high intrinsic time resolution, accuracy and counting efficiency, particularly at the low excitation levels required to maintain cell viability and avoid photobleaching. Using a construct encoding the two fluorescent proteins separated by a fixed-distance amino acid spacer, we were able to measure the fluorescence resonance energy transfer (FRET) efficiency determined by the interchromophore distance. These data revealed that ECFP exhibits complex exponential fluorescence decays under both FRET and non-FRET conditions, as previously reported. Two approaches to calculate the distance between donor and acceptor from the lifetime delivered values within a 10% error range. To confirm that this method can be used also to quantify intermolecular FRET, we labelled cultured neurones with the styryl dye FM1-43, quantified the fluorescence lifetime, then quenched its fluorescence using FM4-64, an efficient energy acceptor for FM1-43 emission. These experiments confirmed directly for the first time that FRET occurs between these two chromophores, characterized the lifetimes of these probes, determined the interchromophore distance in the plasma membrane and provided high-resolution two-dimensional images of lifetime distributions in living neurones.
Figures


Similar articles
-
Quantitative comparison of different fluorescent protein couples for fast FRET-FLIM acquisition.Biophys J. 2009 Oct 21;97(8):2368-76. doi: 10.1016/j.bpj.2009.07.044. Biophys J. 2009. PMID: 19843469 Free PMC article.
-
A feasible add-on upgrade on a commercial two-photon FLIM microscope for optimal FLIM-FRET imaging of CFP-YFP pairs.J Fluoresc. 2013 May;23(3):543-9. doi: 10.1007/s10895-013-1188-8. Epub 2013 Mar 3. J Fluoresc. 2013. PMID: 23456419
-
Rapid global fitting of large fluorescence lifetime imaging microscopy datasets.PLoS One. 2013 Aug 5;8(8):e70687. doi: 10.1371/journal.pone.0070687. Print 2013. PLoS One. 2013. PMID: 23940626 Free PMC article.
-
Protein localization in living cells and tissues using FRET and FLIM.Differentiation. 2003 Dec;71(9-10):528-41. doi: 10.1111/j.1432-0436.2003.07109007.x. Differentiation. 2003. PMID: 14686950 Review.
-
Optical methods in the study of protein-protein interactions.Adv Exp Med Biol. 2010;674:33-42. doi: 10.1007/978-1-4419-6066-5_4. Adv Exp Med Biol. 2010. PMID: 20549938 Review.
Cited by
-
Using FLIM-FRET to measure conformational changes of transglutaminase type 2 in live cells.PLoS One. 2012;7(8):e44159. doi: 10.1371/journal.pone.0044159. Epub 2012 Aug 31. PLoS One. 2012. PMID: 22952912 Free PMC article.
-
YULINK regulates vascular formation in zebrafish and HUVECs.Biol Res. 2023 Feb 27;56(1):7. doi: 10.1186/s40659-023-00415-8. Biol Res. 2023. PMID: 36843032 Free PMC article.
-
FRET spectrometry: a new tool for the determination of protein quaternary structure in living cells.Biophys J. 2013 Nov 5;105(9):1937-45. doi: 10.1016/j.bpj.2013.09.015. Biophys J. 2013. PMID: 24209838 Free PMC article.
-
Advancements and Applications of Conjugated Polyelectrolytes and Conjugated Oligoelectrolytes in Bioanalytical and Electrochemical Contexts.JACS Au. 2024 Dec 3;4(12):4592-4611. doi: 10.1021/jacsau.4c00789. eCollection 2024 Dec 23. JACS Au. 2024. PMID: 39735924 Free PMC article. Review.
-
Mapping the number of molecules and brightness in the laser scanning microscope.Biophys J. 2008 Mar 15;94(6):2320-32. doi: 10.1529/biophysj.107.114645. Epub 2007 Dec 20. Biophys J. 2008. PMID: 18096627 Free PMC article.
References
-
- Bastiaens PI, Squire A. Fluorescence lifetime imaging microscopy: spatial resolution of biochemical processes in the cell. Trends Cell Biol. 1999;9:48–52. - PubMed
-
- Behne MJ, Meyer JW, Hanson KM, Barry NP, Murata S, Crumrine D, Clegg RW, Gratton E, Holleran WM, Elias PM, Mauro TM. NHE1 regulates the stratum corneum permeability barrier homeostasis. Microenvironment acidification assessed with fluorescence lifetime imaging. J. Biol. Chem. 2002;277:47399–47406. - PubMed
-
- Betz WJ, Bewick GS. Optical analysis of synaptic vesicle recycling at the frog neuromuscular junction. Science. 1992;255:200–203. - PubMed
-
- Bevington PR. Data Reduction and Error Analysis for the Physical Sciences. New York: McGraw-Hill; 1969.
Publication types
MeSH terms
Grants and funding
LinkOut - more resources
Full Text Sources
Other Literature Sources