. 2004 Jul 1;18(13):1592-605.
doi: 10.1101/gad.1200204.

Silencing of human polycomb target genes is associated with methylation of histone H3 Lys 27

Affiliations

Silencing of human polycomb target genes is associated with methylation of histone H3 Lys 27

Antonis Kirmizis et al. Genes Dev. .

Abstract

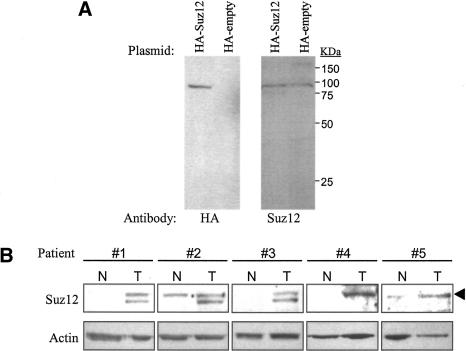
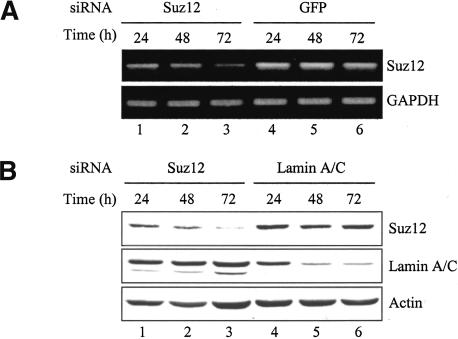
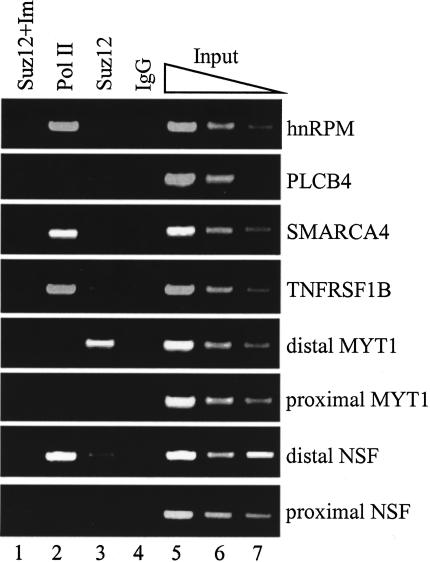
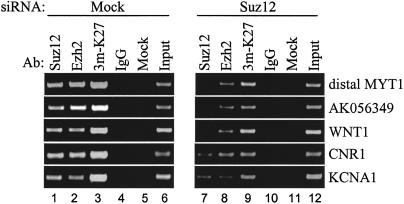
Polycomb group (PcG) complexes 2 and 3 are involved in transcriptional silencing. These complexes contain a histone lysine methyltransferase (HKMT) activity that targets different lysine residues on histones H1 or H3 in vitro. However, it is not known if these histones are methylation targets in vivo because the human PRC2/3 complexes have not been studied in the context of a natural promoter because of the lack of known target genes. Here we report the use of RNA expression arrays and CpG-island DNA arrays to identify and characterize human PRC2/3 target genes. Using oligonucleotide arrays, we first identified a cohort of genes whose expression changes upon siRNA-mediated removal of Suz12, a core component of PRC2/3, from colon cancer cells. To determine which of the putative target genes are directly bound by Suz12 and to precisely map the binding of Suz12 to those promoters, we combined a high-resolution chromatin immunoprecipitation (ChIP) analysis with custom oligonucleotide promoter arrays. We next identified additional putative Suz12 target genes by using ChIP coupled to CpG-island microarrays. We showed that HKMT-Ezh2 and Eed, two other components of the PRC2/3 complexes, colocalize to the target promoters with Suz12. Importantly, recruitment of Suz12, Ezh2 and Eed to target promoters coincides with methylation of histone H3 on Lys 27.


Figures

Figure 1.
Figure 1.
Suz12 protein expression is elevated in human colon tumors. (A) Western blot analysis to demonstrate the specificity of the Suz12 antibody. SW480 cells were transfected with an HA-Suz12 or a control (HA-empty) construct and subjected to immunoblot analysis. Two separate blots were prepared and probed with either an HA antibody (left panel) or a Suz12 antibody (right panel). The HA antibody recognizes only the HA-Suz12 protein and the Suz12 antibody detects both the HA-Suz12 and endogenous Suz12 proteins. (B) Western blot analysis of whole-tissue extracts prepared from normal (N) and tumor (T) tissues of five different colon cancer patients. The blot was first probed with an anti-Suz12 antibody and then reprobed with an antiactin antibody as a loading control. The arrowhead points to the band with the correct size of Suz12 (93 kDa). A second lower band, detected with the Suz12 antibody in patients 1–3, probably represents a protein degradation product.
Figure 2.
Figure 2.
Suz12 expression in colon cancer cells is disrupted by RNA interference. (A) RT–PCR analysis on total RNA extracted from SW480 cells at various time points after transfection with Suz12 or GFP siRNA duplexes. Primers specific to the GAPDH mRNA were used in RT–PCR to ensure that the RNA was correctly quantitated. (B) Western blot analysis on whole-cell extracts prepared from SW480 cells at various time points after transfection with Suz12 or Lamin A/C siRNA duplexes. Antibodies against Suz12 and Lamin A/C were used to show specific depletion of the respective proteins. The blot was also probed with the actin antibody to demonstrate equal loading of protein samples.
Figure 3.
Figure 3.
Removal of Suz12 from SW480 cells results in alteration of gene expression. (A) Schematic showing the comparisons among the four Affymetrix U133A arrays that were used to analyze gene expression in cells incubated with either Suz12 or GFP siRNAs. The numbers on the arrows correspond to the columns in B. Columns 1, 2, 3, and 4 represent siSuz12 versus siGFP comparisons and thus allow identification of up- and down-regulated genes. Columns 5 and 6 are comparisons of identical samples; these should show no variation and were used to identify false positives. (B) Tree-view diagram depicting the genes that were significantly deregulated upon Suz12 depletion. Red represents up-regulated genes, and green represents down-regulated genes in the Suz12 RNAi samples in reference to the GFP RNAi samples. The numbers on the color scheme represent the fold changes in gene expression. Genes denoted with an asterisk (*) were identified more than once on the microarrays. (C) RT–PCR analysis of independent RNAi experiments confirming the results obtained using the microarrays. Primers specific to GAPDH mRNA were used in RT–PCR to ensure that the RNA was correctly quantitated.
Figure 4.
Figure 4.
The MYT1 promoter is directly regulated by Suz12. Chromatin immunoprecipitation experiments were performed in SW480 cells using antibodies to RNA Polymerase II (lane 2), Suz12 (lane 3), and a control IgG (lane 4). A control immunoprecipitation was also performed with a Suz12 antibody that was preincubated with the Suz12 immunogen at a 10-fold excess by weight (lane 1). Three dilutions of the total input are also shown (lanes 57). The precipitated chromatin was analyzed with PCR using primers specific to the promoters of the indicated genes.
Figure 7.
Figure 7.
The Suz12 target promoters are bound by other PRC2/3 components and are methylated at Lys 27 of histone H3. (A) A schematic of the distal MYT1 promoter locus is shown; the positive and negative numbers indicate the position in the promoter relative to the transcriptional start site represented by the arrow. The lines below the MYT1 locus represent the promoter fragments amplified by the different PCR primer pairs. (B) ChIP experiments were performed in SW480 cells using antibodies to Suz12, Eed, Ezh2, tri-methyl H3-K27, trimethyl H3-K9, histone H3, and RNA Polymerase II. The immunoprecipitated chromatin from each ChIP sample was used to prepare amplicons by LM–PCR as described in Materials and Methods. The amplicons were then analyzed by PCR. The number of each lane corresponds to the primer pair indicated in A. Amplicons prepared from input chromatin were used as a positive control. (C) Shown are examples of the size of DNA from a ChIP experiment (left panel) and amplicons prepared from a typical LM–PCR reaction (right panel). (D) ChIP experiments in SW480 cells using the same antibodies as in B. A nonspecific IgG antibody (lane 6) was used as a negative control, and three dilutions of the input chromatin (lanes 79) were used as positive controls to demonstrate linear amplification. The immunoprecipitated chromatin was analyzed by PCR using primers specific to the promoters of the genes indicated.
Figure 5.
Figure 5.
Mapping of Suz12 binding to its target promoters. Oligonucleotide microarrays containing probes that represent a 5-kb region from each promoter of the identified Suz12-regulated genes (Fig. 3B) were prepared. The arrays were hybridized with amplicons prepared from ChIP experiments using a Suz12 antibody, a nonspecific IgG antibody, and an input control. Shown are six promoter regions: three that were up-regulated (MYT1, EIF3S10, PLCB4) upon removal of Suz12 from cells and three that were down-regulated (SYBL1, RBMS1, RetSDR) upon removal of Suz12 from cells. The fold enrichment was calculated by dividing the Suz12 or IgG hybridization intensity signal by the input control signal for each oligonucleotide probe. The inserts within each graph show independent ChIP confirmation using PCR analysis. The primers used in the PCR analysis were designed to span the region showing the highest peak of enrichment for each promoter. A complete list of the Suz12-bound promoters and the position of binding is shown in Table 1.
Figure 6.
Figure 6.
Identification of additional direct Suz12 target genes. (A) Scatter plot showing the intensities of the spots on the CpG-island microarrays. Two independent experiments were performed to identify Suz12-bound loci in SW480 cells. In red are the spot intensities from a representative array that was hybridized with Suz12 and input amplicons. Shown in green are the spot intensities of a representative array that was hybridized with IgG and input amplicons. Red spots that enriched at least threefold were selected for further analysis. The spots shown in blue were enriched at least threefold in both the Suz12 and IgG control immunoprecipitations and represent DNA fragments that precipitate nonspecifically in the ChIP procedure. (B) Confirmation and mapping of Suz12 binding to a 5-kb region of each promoter identified in A was performed using custom oligonucleotide promoter arrays. The arrays were prepared and hybridized as in Figure 5. Shown are the fold enrichments from the Suz12 and input comparisons of six promoters: four true positive targets and two (TLK2 and PVALB) false positives. (C) Confirmation of the results shown in B using PCR analysis. Independent ChIP experiments were performed in SW480 cells using antibodies to RNA Polymerase II (lane 1), Suz12 (lane 2), and a control IgG (lane 3). Three dilutions of the input chromatin are also shown (lanes 46). The precipitated chromatin was analyzed with PCR using primers specific to the promoters of the indicated genes.
Figure 8.
Figure 8.
Methylation of H3-K27 at the Suz12 target promoters is due to Suz12-mediated recruitment of the methyltransferase Ezh2. ChIP experiments were performed using antibodies to Suz12 (lanes 1,6), Ezh2 (lanes 2,7), trimethyl H3-K27 (lanes 3,8), and a control IgG (lanes 4,9) in SW480 cells that were incubated with siSuz12 smart-pool or no siRNA (mock). For the siRNA transfections, cells were incubated with the indicated siRNA for 72 h, then replated and transfected for another 72 h. The immunoprecipitated chromatin was analyzed by PCR using primers specific to the promoters of the genes indicated. An equal amount of DNA from both treatments was monitored using PCR as shown by the similar intensity of the two input signals (cf. lanes 6 and 12).

References

    1. Barnett M.W., Seville, R.A., Nijjar, S., Old, R.W., and Jones, E.A. 2001. Xenopus Enhancer of zeste (XEZ); an anteriorly restricted polycomb gene with a role in neural patterning. Mech. Dev. 102: 157-167. - PubMed
    1. Bellefroid E.J., Bourguignon, C., Hollemann, T., Ma, Q., Anderson, D.J., Kintner, C., and Pieler, T. 1996. X-MyT1, a Xenopus C2HC-type zinc finger protein with a regulatory function in neuronal differentiation. Cell 87: 1191-1202. - PubMed
    1. Bienz M. and Clevers, H. 2000. Linking colorectal cancer to Wnt signaling. Cell 103: 311-320. - PubMed
    1. Bloyer S., Cavalli, G., Brock, H.W., and Dura, J.M. 2003. Identification and characterization of polyhomeotic PREs and TREs. Dev. Biol. 261: 426-442. - PubMed
    1. Bracken A.P., Pasini, D., Capra, M., Prosperini, E., Colli, E., and Helin, K. 2003. EZH2 is downstream of the pRB-E2F pathway, essential for proliferation and amplified in cancer. EMBO J 22: 5323-5335. - PMC - PubMed

Publication types

MeSH terms

LinkOut - more resources