. 2004 Jul;14(7):1207-20.
doi: 10.1101/gr.2639304.

A phylogeny of caenorhabditis reveals frequent loss of introns during nematode evolution

Affiliations

A phylogeny of caenorhabditis reveals frequent loss of introns during nematode evolution

Soochin Cho et al. Genome Res. 2004 Jul.

Abstract

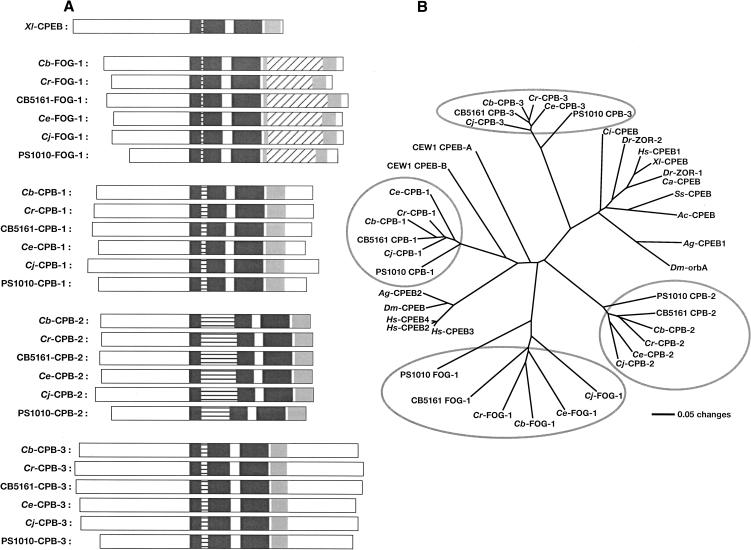
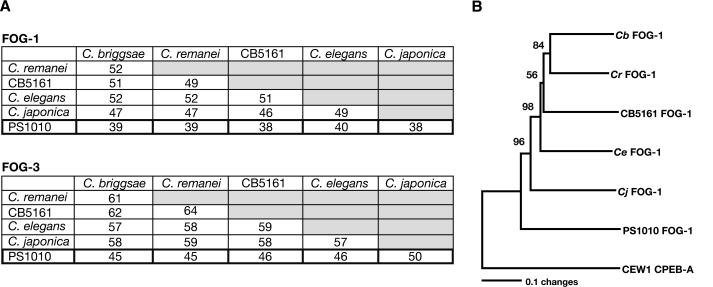
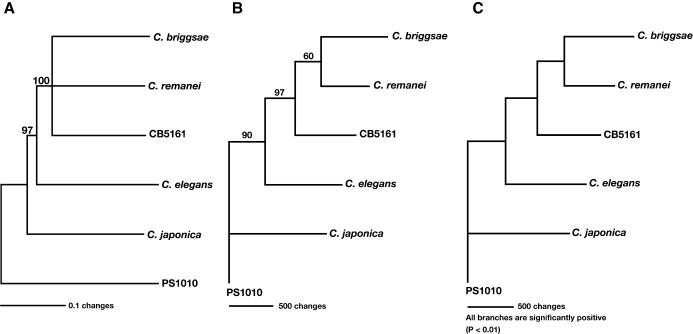
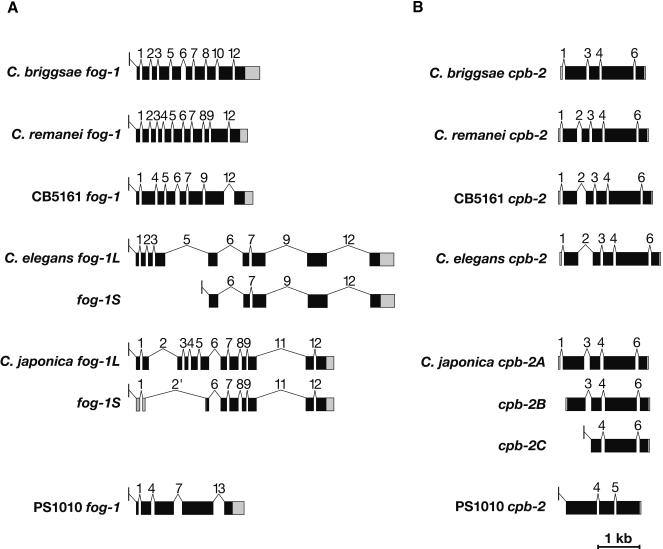
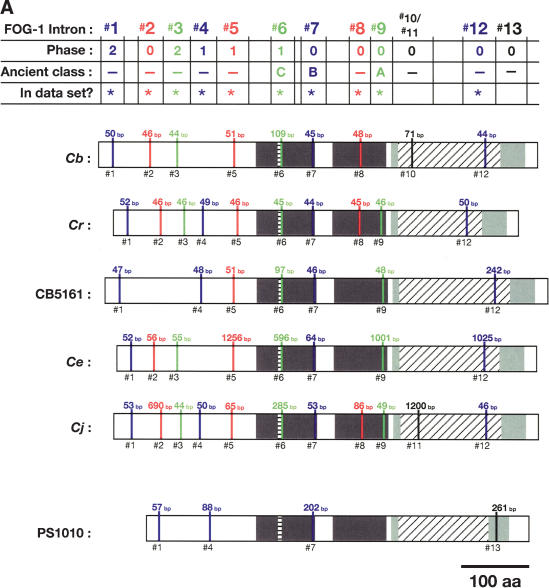
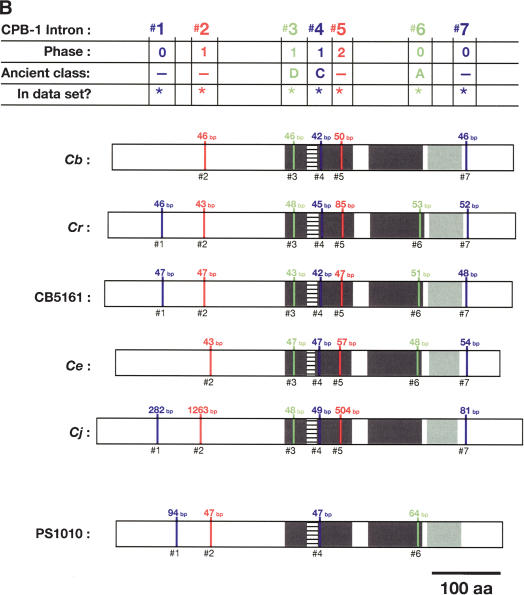
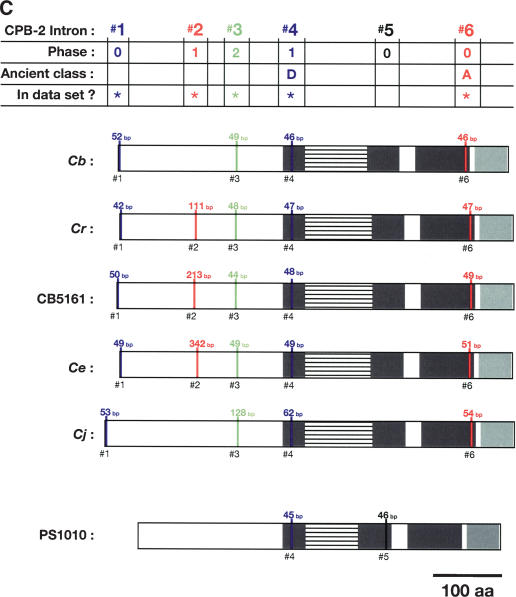
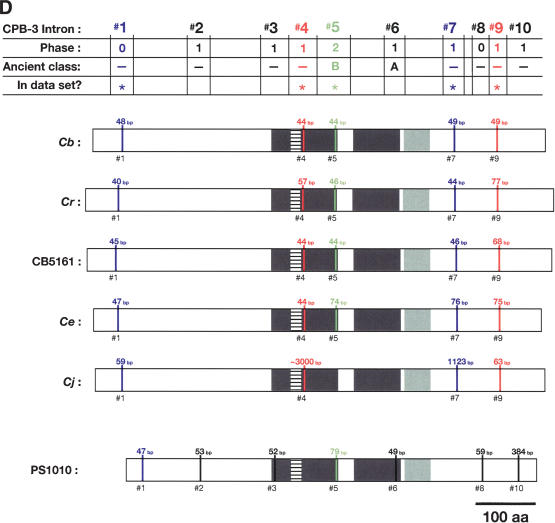
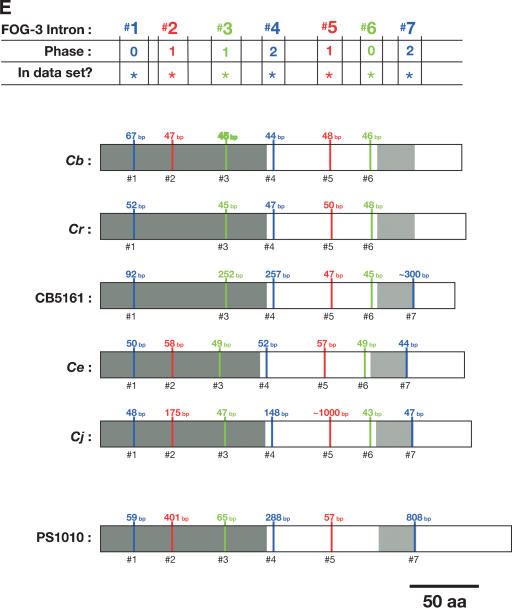
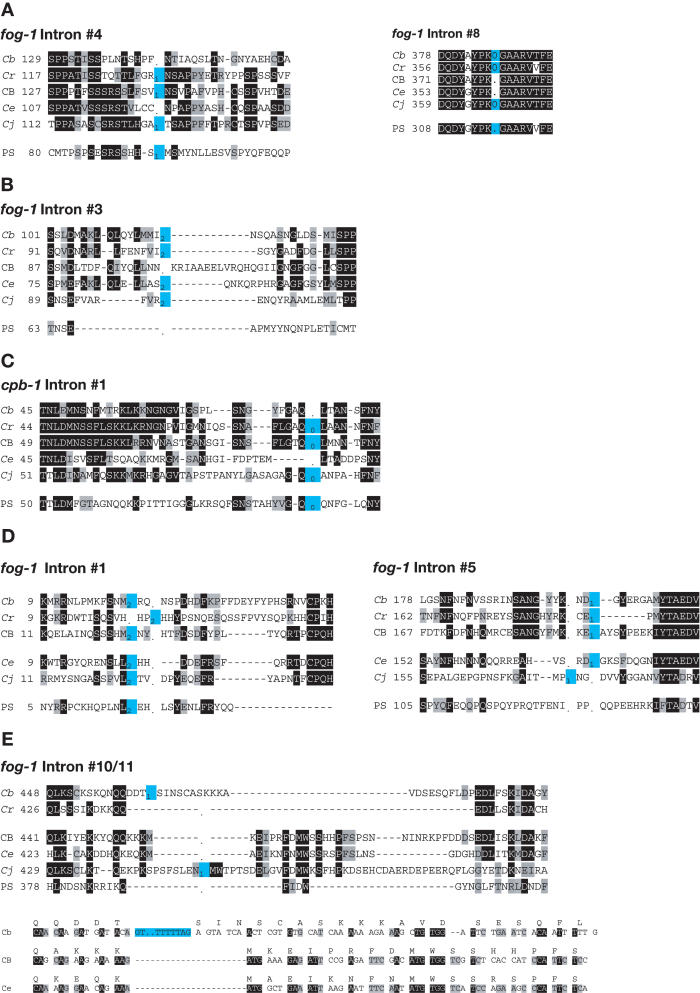
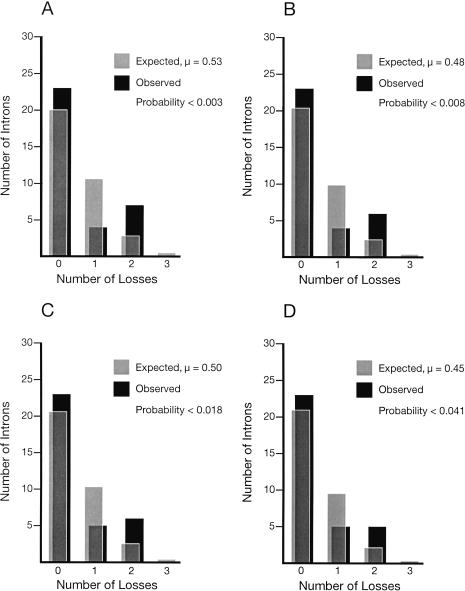
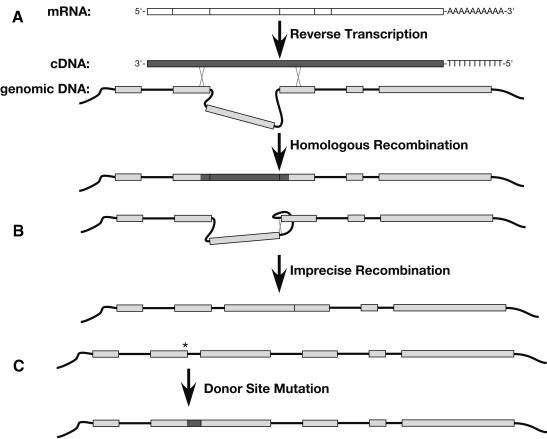
Since introns were discovered 26 years ago, people have wondered how changes in intron/exon structure occur, and what role these changes play in evolution. To answer these questions, we have begun studying gene structure in nematodes related to Caenorhabditis elegans. As a first step, we cloned a set of five genes from six different Caenorhabditis species, and used their amino acid sequences to construct the first detailed phylogeny of this genus. Our data indicate that nematode introns are lost at a very high rate during evolution, almost 400-fold higher than in mammals. These losses do not occur randomly, but instead, favor some introns and do not affect others. In contrast, intron gains are far less common than losses in these genes. On the basis of the sequences at each intron site, we suggest that several distinct mechanisms can cause introns to be lost. The small size of C. elegans introns should increase the rate at which each of these types of loss can occur, and might account for the dramatic difference in loss rate between nematodes and mammals.


Figures

Figure 1
Figure 1
Each Caenorhabditis species has four CPEB genes. (A) CPEB domain structures. Each protein is depicted as a white box, with the amino terminus at the left. The RNA recognition motifs (RRMs) are dark gray and the C-H domain is light gray. Insertions within the first RRM are horizontally striped, and insertions within the C-H domain are diagonally striped. (Xl) Xenopus laevis; (Cb) Caenorhabditis briggsae; (Cr) C. remanei; (CB5161) C. sp. CB5161; (Ce) C. elegans; (Cj) C. japonica; (PS1010) C. sp. PS1010. (B) Neighbor-joining tree showing the relationships among CPEB genes. This tree is based on an alignment of sequences from the conserved RRM1, RRM2, and C-H domains. Each nematode gene family is circled in gray. Nematodes are listed in A, but also include Oscheius tipulae (CEW1). Other animals are as follows: (Dm) Drosophila melanogaster; (Ag) Anopheles gambiae (malaria mosquito); (Ss) Spisula solidissima (Atlantic surf clam); (Ac) Aplysia californica (California sea hare); (Ci) Ciona intestinalis (ascidian tadpole); (Dr) Danio rerio (zebra fish); (Ca) Carassius auratus (gold fish); (Hs) Homo sapiens.
Figure 2
Figure 2
PS1010 is an outgroup for C. elegans and its close relatives. (A) Percent identity values for the FOG-1 and FOG-3 proteins of each species. (B) Neighbor-joining tree of nematode FOG-1 sequences. Because they were hard to align, we excuded the amino terminus of each FOG-1 protein from this analysis; these excluded sequences totaled 60–128 amino acid residues per protein. (The total size range for the FOG-1 proteins was 564–653 residues). We chose the Oscheius tipulae CEW1 CPEB-A protein as our outgroup, and used PAUP* 4.0b10 for the calculations. Bootstrap confidence values are presented at each node, and were based on 10,000 replications.
Figure 3
Figure 3
Phylogeny of the genus Caenorhabditis. (A) Neighbor-joining tree. The FOG-1, CPB-1, CPB-2, CPB-3, and FOG-3 sequences were concatenated, giving a total of 2839 characters for each species. We aligned the sequences using ClustalX, with final adjustments by hand, and used PAUP* 4.0b10 to build the tree. After 10,000 bootstrap replications, only segregations with a support value higher than 60% were accepted as significant. (B) Maximum Parsimony tree. We used PAUP* 4.0b10. Only segregations with a support value higher than 60% after 500 bootstrap replications were accepted as significant. (C) Maximum Likelihood tree. We used the Phylip software package and the JTT amino acid change model for these calculations.
Figure 4
Figure 4
(A) The fog-1 gene family. (B) The cpb-2 family. Changes in splicing structure in the fog-1 and cpb-2 genes. We cloned cDNAs as described in the Methods section, and determined gene structures by comparing cDNA and genomic DNA sequences. Protein-coding regions are shown as black boxes, noncoding regions as gray boxes, and introns as thin lines. The SL1 leader sequence is shown as a small exon located above the line. All genes were drawn to scale.
Figure 5
Figure 5
Alignment of conserved intron positions. The coding region of each gene is shown as a rectangle drawn to scale. (A–D) The RNA recognition motifs (RRMs) are dark gray, the C-H domain is light gray, insertions within the first RRM are horizontally striped, and insertions within the C-H domain are diagonally striped. (E) The BTF domain is dark gray, and the TF domain is light gray (Chen et al. 2000). Introns are shown as vertical lines within each gene, with size above, and number below. The introns used in our data set are colored blue, red, or green to make it easy to compare homologs between species. Phase 0 introns lie between codons, phase 1 introns after the first nucleotide of a codon, and phase 2 introns after the second nucleotide. Ancient introns A, B, C, and D were found in more than one CPEB gene.
Figure 5
Figure 5
Alignment of conserved intron positions. The coding region of each gene is shown as a rectangle drawn to scale. (A–D) The RNA recognition motifs (RRMs) are dark gray, the C-H domain is light gray, insertions within the first RRM are horizontally striped, and insertions within the C-H domain are diagonally striped. (E) The BTF domain is dark gray, and the TF domain is light gray (Chen et al. 2000). Introns are shown as vertical lines within each gene, with size above, and number below. The introns used in our data set are colored blue, red, or green to make it easy to compare homologs between species. Phase 0 introns lie between codons, phase 1 introns after the first nucleotide of a codon, and phase 2 introns after the second nucleotide. Ancient introns A, B, C, and D were found in more than one CPEB gene.
Figure 6
Figure 6
(A) Perfect deletions. (B) Deletion with 3′ insertion. (C) Deletion with associated mutation. (D) Intron sliding. (E) Intron insertions. Sequences of selected intron sites. The starting position of each sequence follows the species name. Identical amino acids are shaded black, similar ones are shaded gray, and intron sites are colored blue. A “-“is used for amino acid gaps, and a “.” for intron gaps. Phase 0 introns lie between the indicated codons, and phase 1 or 2 introns lie within the codon to the left. The bottom half of E contains nucleotide sequences, with the translation above the line. (Cb) C. briggsae; (Cr) C. remanei; (CB) C. sp. CB5161; (Ce) C. elegans; (Cj) C. japonica; (PS) C. sp. PS1010.
Figure 7
Figure 7
(A) Model 1. (B) Model 2. (C) Model 3. (D) Model 4. Introns are not lost randomly. The four models are described in Table 3. However, as Models 2 and 4 assume that cpb-2 intron #2 was created sometime after the split between the ancestor of C. japonica and that of the other species, this intron was excluded from the calculations, leaving only 33 ancestral introns in the data set for these two models. This correction allowed us to consider only introns that have existed for the same length of time.
Figure 8
Figure 8
Mechanisms of intron loss. (A) Loss by recombination with cDNA. In the genomic DNA, coding sequences are shown as gray boxes. Sites of recombination are marked with an X. (B) Loss by deletion. Only one of several possible mechanisms for deletion is shown. (C) Loss by mutation of the donor site. (*) The site of a point mutation that destroys the donor site. The dark gray box indicates in-frame intron sequences that have become part of the coding sequence.

Similar articles

Cited by

References

    1. Baird, S.E., Sutherlin, M.E., and Emmons, S.W. 1992. Reproductive isolation in Rhabditidae (Nematoda:Secernentea); mechanisms that isolate six species of three genera. Evolution 46: 585–594. - PubMed
    1. Baldwin, J.G., Frisse, L.M., Vida, J.T., Eddleman, C.D., and Thomas, W.K. 1997. An evolutionary framework for the study of developmental evolution in a set of nematodes related to Caenorhabditis elegans. Mol. Phylogenet. Evol. 8: 249–259. - PubMed
    1. Blake, C.C. 1978. Do genes-in-pieces imply protein-in-pieces? Nature 273: 267–268.
    1. Blaxter, M.L., De Ley, P., Garey, J.R., Liu, L.X., Scheldeman, P., Vierstraete, A., Vanfleteren, J.R., Mackey, L.Y., Dorris, M., Frisse, L.M., et al. 1998. A molecular evolutionary framework for the phylum Nematoda. Nature 392: 71–75. - PubMed
    1. Blumenthal, T. and Steward, K. 1997. RNA processing and gene structure. In C. elegans II (eds. D.L. Riddle et al.), pp. 117–145. Cold Spring Harbor Laboratory Press, Cold Spring Harbor, NY. - PubMed

Publication types

MeSH terms