. 2004 Jul;14(7):1362-73.
doi: 10.1101/gr.2242604.

Regulog analysis: detection of conserved regulatory networks across bacteria: application to Staphylococcus aureus

Affiliations

Regulog analysis: detection of conserved regulatory networks across bacteria: application to Staphylococcus aureus

Wynand B L Alkema et al. Genome Res. 2004 Jul.

Abstract

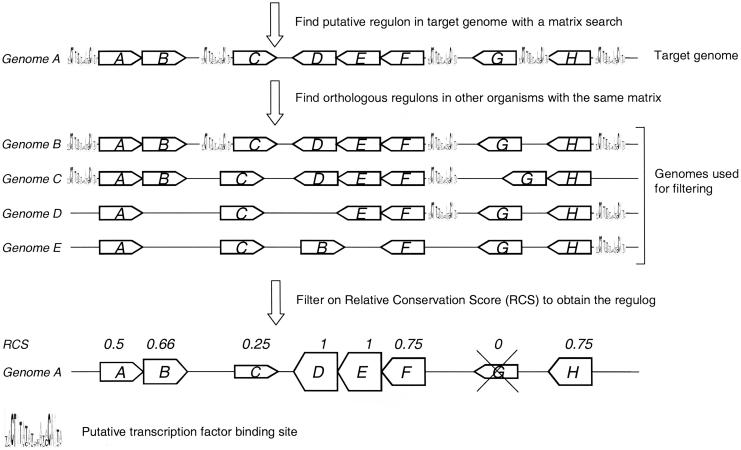
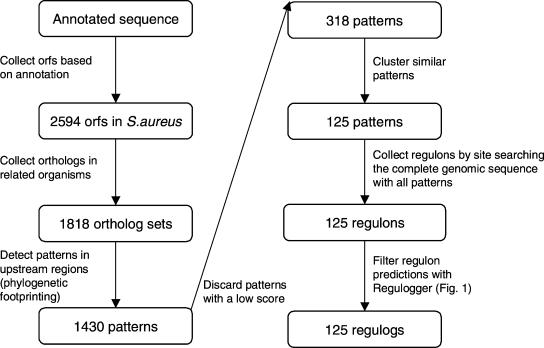
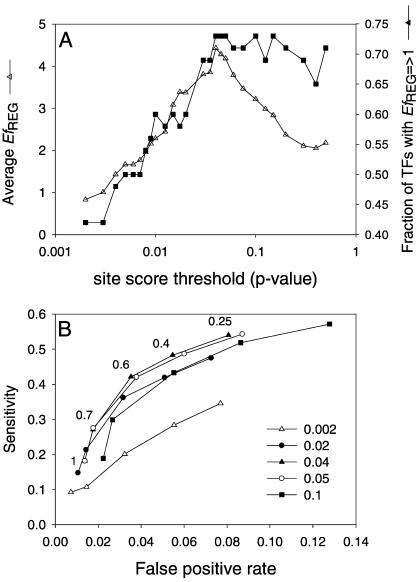
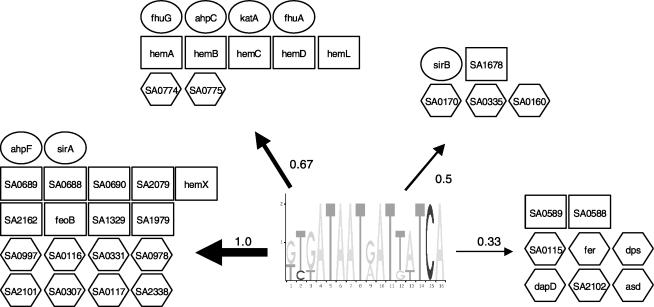
A transcriptional regulatory network encompasses sets of genes (regulons) whose expression states are directly altered in response to an activating signal, mediated by trans-acting regulatory proteins and cis-acting regulatory sequences. Enumeration of these network components is an essential step toward the creation of a framework for systems-based analysis of biological processes. Profile-based methods for the detection of cis-regulatory elements are often applied to predict regulon members, but they suffer from poor specificity. In this report we describe Regulogger, a novel computational method that uses comparative genomics to eliminate spurious members of predicted gene regulons. Regulogger produces regulogs, sets of coregulated genes for which the regulatory sequence has been conserved across multiple organisms. The quantitative method assigns a confidence score to each predicted regulog member on the basis of the degree of conservation of protein sequence and regulatory mechanisms. When applied to a reference collection of regulons from Escherichia coli, Regulogger increased the specificity of predictions up to 25-fold over methods that use cis-element detection in isolation. The enhanced specificity was observed across a wide range of biologically meaningful parameter combinations, indicating a robust and broad utility for the method. The power of computational pattern discovery methods coupled with Regulogger to unravel transcriptional networks was demonstrated in an analysis of the genome of Staphylococcus aureus. A total of 125 regulogs were found in this organism, including both well-defined functional groups and a subset with unknown functions.


Figures

Figure 1
Figure 1
Outline of the Regulogger method. First a putative regulon in the target genome (Genome A) is predicted by searching the entire genome for genes with a particular cis-RE in their upstream region. This predicted regulon in genome A is shown at the top. Regulogger identifies regulons in other genomes (B, C, D, and E) that are regulated by the same cis-RE. On the basis of the fraction of orthologs in other genomes (indicated in this figure by the same letter) that are regulated by the same cis-RE, a relative conservation score (RCS) is calculated. The RCS is shown above the genes in the final regulog. The height of the box for each gene correlates to the RCS for that gene, and thus indicates the confidence of the predictions. Predicted regulon members that have an RCS of 0 are regarded as false-positive predictions and are not present in the final regulog.
Figure 2
Figure 2
Schematic representation of the strategy to identify regulogs in S. aureus. From the genomic sequence, protein-coding regions are identified. For all proteins, orthologs in other genomes are defined. These ortholog sets are used for phylogenetic footprinting, in which Gibbs sampling is run on upstream regions of sets of orthologous genes to obtain putative regulatory motifs (e.g., binding sites). Low-scoring patterns are filtered and patterns with similar sequences are clustered. For each pattern, the putative regulon in S. aureus is defined. These predicted regulons are filtered with the Regulogger method described in Figure 1. This produces a set of regulogs, conserved regulons, in S. aureus.
Figure 3
Figure 3
Phylogenetic relationship of the organism used in this study, based on the 16sRNA sequence. The genomes of B. subtilis, B. halodurans, and L. monocytogenes were used for application Regulogger to the regulons in S. aureus. The genomes of E. coli, Y. pestis, V. cholerae, H. influenzae, and P. aeruginosa were used for validation of Regulogger.
Figure 4
Figure 4
Phylogenetic footprinting on the genome of S. aureus. (Gray) The distribution of the average MAP-values that were obtained by performing Gibbs sampling on orthologous regulatory regions; (Black) the distribution of scores that were obtained using randomized upstream cis-REs with the same AT content, length, and average identity as the real orthologous regulatory regions.
Figure 5
Figure 5
(A) Efficiency of Regulogger at different site-score thresholds used to predict regulons. Regulogger efficiency (EfREG) for the individual transcription factors was calculated on the basis of the sensitivity and specificity of the regulon and regulog predictions as described in the text. (B) ROC curve showing the sensitivity vs. false-positive rate of Regulogger. The ROC curves were calculated with different settings of the site-score threshold as indicated in the legend. The numbers in the figure indicate the various cut-off values for the RCS. The leftmost point in each curve corresponds to the most stringent cut off (RCS = 1); the rightmost point of each curve corresponds to an RCS of 0.25.
Figure 6
Figure 6
Schematic representation of the predicted fur regulog. The logo represents the pattern that was obtained by phylogenetic footprinting. The arrows that connect the pattern and the groups of genes under the control of the pattern indicate the relative conservation score of the gene, the thickest arrows belonging to the most-conserved genes, for which we thus have a high confidence that they belong to the regulog. Ovals indicate known members in S. aureus. Rectangles indicate genes that may be suspected to be in the Fur regulog, on the basis of their sequence similarity to proteins in other organisms that have been shown to be regulated by Fur. Hexagonal boxes represent new members of the regulog. This means that they are predicted by Regulogger to be regulated by Fur, but no experimental evidence exists.

References

    1. Aerts, S., Thijs, G., Coessens, B., Staes, M., Moreau, Y., and De Moor, B. 2003. Toucan: Deciphering the cis-regulatory logic of coregulated genes. Nucleic Acids Res. 31: 1753–1764. - PMC - PubMed
    1. Baichoo, N., Wang, T., Ye, R., and Helmann, J.D. 2002. Global analysis of the Bacillus subtilis Fur regulon and the iron starvation stimulon. Mol. Microbiol. 45: 1613–1629. - PubMed
    1. Berg, O.G. 1988. Selection of DNA binding sites by regulatory proteins: The LexA protein and the arginine repressor use different strategies for functional specificity. Nucleic Acids Res. 16: 5089–5105. - PMC - PubMed
    1. Blanchette, M. and Tompa, M. 2002. Discovery of regulatory elements by a computational method for phylogenetic footprinting. Genome Res. 12: 739–748. - PMC - PubMed
    1. Bockhorst, J., Craven, M., Page, D., Shavlik, J., and Glasner, J. 2003. A Bayesian network approach to operon prediction. Bioinformatics 19: 1227–1235. - PubMed

Publication types

LinkOut - more resources