

Construction and validation of the Rhodobacter sphaeroides 2.4.1 DNA microarray: transcriptome flexibility at diverse growth modes
- PMID: 15231807
- PMCID: PMC438620
- DOI: 10.1128/JB.186.14.4748-4758.2004
Construction and validation of the Rhodobacter sphaeroides 2.4.1 DNA microarray: transcriptome flexibility at diverse growth modes
Abstract
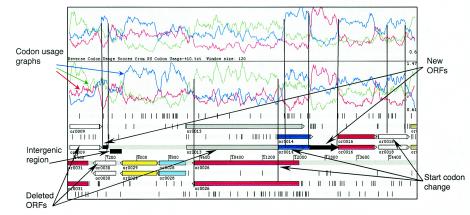
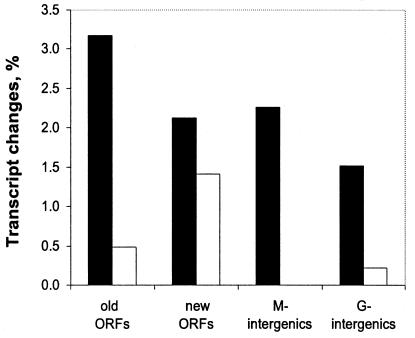
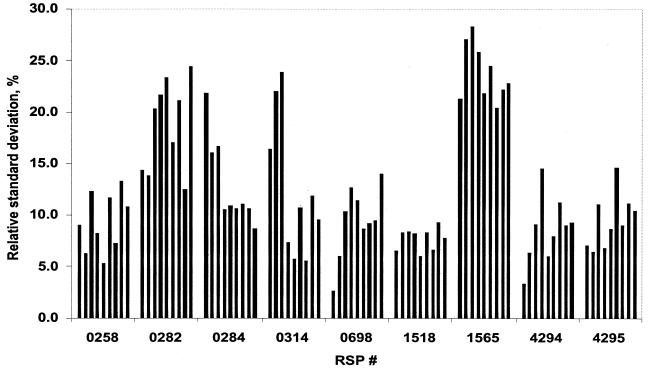
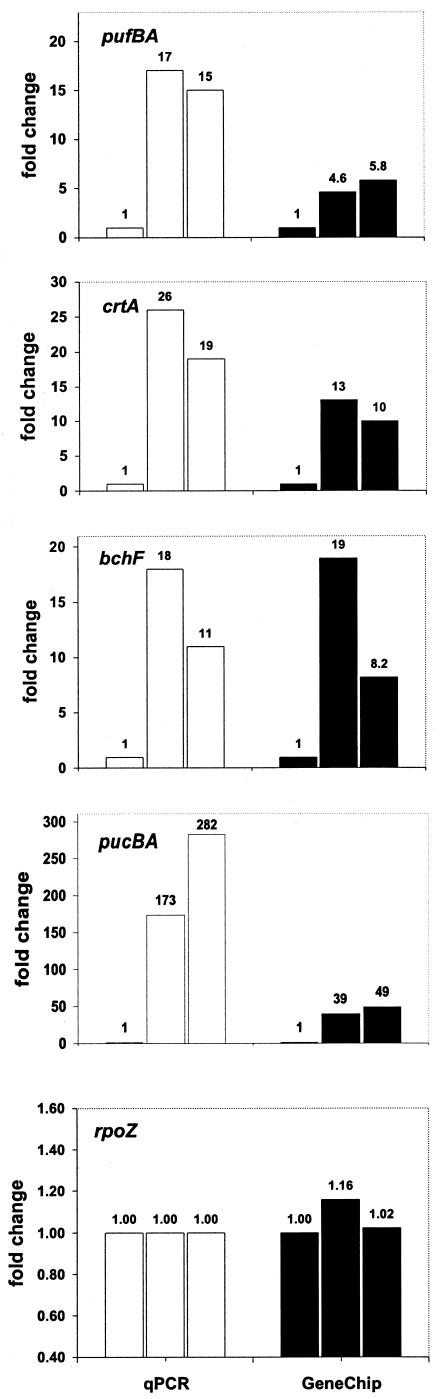
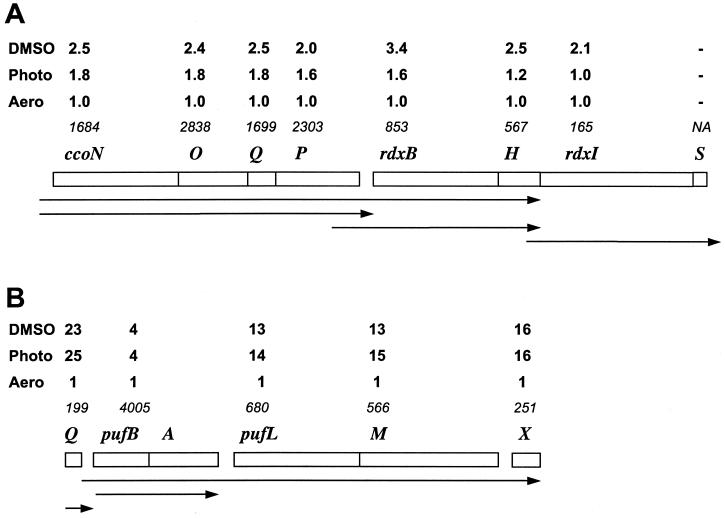
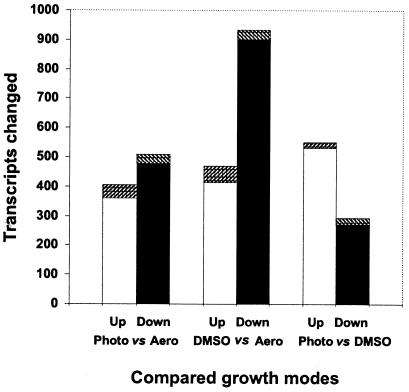
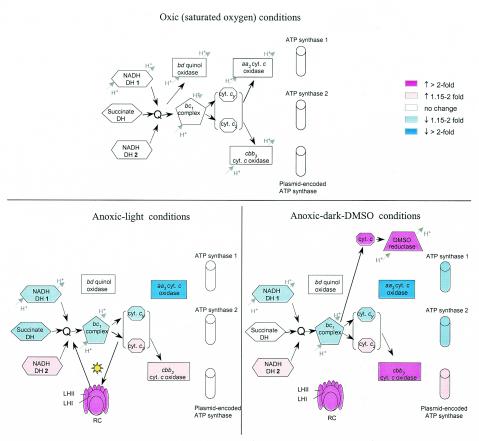
A high-density oligonucleotide DNA microarray, a genechip, representing the 4.6-Mb genome of the facultative phototrophic proteobacterium, Rhodobacter sphaeroides 2.4.1, was custom-designed and manufactured by Affymetrix, Santa Clara, Calif. The genechip contains probe sets for 4,292 open reading frames (ORFs), 47 rRNA and tRNA genes, and 394 intergenic regions. The probe set sequences were derived from the genome annotation generated by Oak Ridge National Laboratory after extensive revision, which was based primarily upon codon usage characteristic of this GC-rich bacterium. As a result of the revision, numerous missing ORFs were uncovered, nonexistent ORFs were deleted, and misidentified start codons were corrected. To evaluate R. sphaeroides transcriptome flexibility, expression profiles for three diverse growth modes--aerobic respiration, anaerobic respiration in the dark, and anaerobic photosynthesis--were generated. Expression levels of one-fifth to one-third of the R. sphaeroides ORFs were significantly different in cells under any two growth modes. Pathways involved in energy generation and redox balance maintenance under three growth modes were reconstructed. Expression patterns of genes involved in these pathways mirrored known functional changes, suggesting that massive changes in gene expression are the major means used by R. sphaeroides in adaptation to diverse conditions. Differential expression was observed for genes encoding putative new participants in these pathways (additional photosystem genes, duplicate NADH dehydrogenase, ATP synthases), whose functionality has yet to be investigated. The DNA microarray data correlated well with data derived from quantitative reverse transcription-PCR, as well as with data from the literature, thus validating the R. sphaeroides genechip as a powerful and reliable tool for studying unprecedented metabolic versatility of this bacterium.
Copyright 2004 American Society for Microbiology
Figures
Similar articles
-
The transition of Rhodobacter sphaeroides into a microbial cell factory.Biotechnol Bioeng. 2021 Feb;118(2):531-541. doi: 10.1002/bit.27593. Epub 2020 Oct 23. Biotechnol Bioeng. 2021. PMID: 33038009 Free PMC article. Review.
-
Transcriptome dynamics during the transition from anaerobic photosynthesis to aerobic respiration in Rhodobacter sphaeroides 2.4.1.J Bacteriol. 2008 Jan;190(1):286-99. doi: 10.1128/JB.01375-07. Epub 2007 Oct 26. J Bacteriol. 2008. PMID: 17965166 Free PMC article.
-
Transcriptome and physiological responses to hydrogen peroxide of the facultatively phototrophic bacterium Rhodobacter sphaeroides.J Bacteriol. 2005 Nov;187(21):7232-42. doi: 10.1128/JB.187.21.7232-7242.2005. J Bacteriol. 2005. PMID: 16237007 Free PMC article.
-
Thioredoxin is essential for Rhodobacter sphaeroides growth by aerobic and anaerobic respiration.Microbiology (Reading). 1997 Jan;143 ( Pt 1):83-91. doi: 10.1099/00221287-143-1-83. Microbiology (Reading). 1997. PMID: 9025281
-
Photosynthetic electron transport and anaerobic metabolism in purple non-sulfur phototrophic bacteria.Antonie Van Leeuwenhoek. 1994;66(1-3):151-64. doi: 10.1007/BF00871637. Antonie Van Leeuwenhoek. 1994. PMID: 7747929 Review.
Cited by
-
Probing the role of copper in the biosynthesis of the molybdenum cofactor in Escherichia coli and Rhodobacter sphaeroides.J Biol Inorg Chem. 2007 Nov;12(8):1129-39. doi: 10.1007/s00775-007-0279-x. Epub 2007 Aug 9. J Biol Inorg Chem. 2007. PMID: 17687573
-
Cyclic diguanylate is a ubiquitous signaling molecule in bacteria: insights into biochemistry of the GGDEF protein domain.J Bacteriol. 2005 Mar;187(5):1792-8. doi: 10.1128/JB.187.5.1792-1798.2005. J Bacteriol. 2005. PMID: 15716451 Free PMC article.
-
Hierarchical regulation of photosynthesis gene expression by the oxygen-responsive PrrBA and AppA-PpsR systems of Rhodobacter sphaeroides.J Bacteriol. 2008 Dec;190(24):8106-14. doi: 10.1128/JB.01094-08. Epub 2008 Oct 17. J Bacteriol. 2008. PMID: 18931128 Free PMC article.
-
The transition of Rhodobacter sphaeroides into a microbial cell factory.Biotechnol Bioeng. 2021 Feb;118(2):531-541. doi: 10.1002/bit.27593. Epub 2020 Oct 23. Biotechnol Bioeng. 2021. PMID: 33038009 Free PMC article. Review.
-
Application of the accurate mass and time tag approach to the proteome analysis of sub-cellular fractions obtained from Rhodobacter sphaeroides 2.4.1. Aerobic and photosynthetic cell cultures.J Proteome Res. 2006 Aug;5(8):1940-7. doi: 10.1021/pr060050o. J Proteome Res. 2006. PMID: 16889416 Free PMC article.
References
-
- Boldogkoi, Z. 2000. Coding in the noncoding DNA strand: a novel mechanism of gene evolution? J. Mol. Evol. 51:600-606. - PubMed
-
- Braatsch, S., M. Gomelsky, S. Kuphal, and G. Klug. 2002. The single flavoprotein, AppA, from Rhodobacter sphaeroides integrates both redox and light signals. Mol. Microbiol. 45:827-836. - PubMed
Publication types
MeSH terms
Substances
Grants and funding
LinkOut - more resources
Full Text Sources
Research Materials
Miscellaneous
