

doi: 10.1126/science.1099791.
Mass spectrometric imaging of highly curved membranes during Tetrahymena mating
Affiliations
- PMID: 15232100
- PMCID: PMC2833272
- DOI: 10.1126/science.1099791
Item in Clipboard
Mass spectrometric imaging of highly curved membranes during Tetrahymena mating
Science.
.
Abstract
Biological membrane fusion is crucial to numerous cellular events, including sexual reproduction and exocytosis. Here, mass spectrometry images demonstrate that the low-curvature lipid phosphatidylcholine is diminished in the membrane regions between fusing Tetrahymena, where a multitude of highly curved fusion pores exist. Additionally, mass spectra and principal component analysis indicate that the fusion region contains elevated amounts of 2-aminoethylphosphonolipid, a high-curvature lipid. This evidence suggests that biological fusion involves and might in fact be driven by a heterogeneous redistribution of lipids at the fusion site.
Figures

Hundreds of fusion pores observed during Tetrahymena conjugation result in lipid heterogeneity at membrane fusion sites. Scale bars are 50 μm unless otherwise noted. (A) Brightfield images of Tetrahymena before mating and (B) during full conjugation (arrows). (C) A TEM of a 70-nm cross section through mating Tetrahymena showing eight fusion pores along the conjugation junction in this plane of view. Therefore, an estimated pore density for the entire junction is about 200 fusion pores, in agreement with the literature (2). Scale bar, 2 μm. (D) A schematic of the membrane fusion intermediate structure, the stalk. The wavy lines depict the acyl tail-groups of the membrane phospholipids. The white circles represent the headgroup of PC, a cylinder-shaped lamellar lipid. The black circles represent the headgroup of PE, a cone-shaped nonlamellar lipid. Membrane fusion sites probably contain a large quantity of cone-shaped lipids, because those lipids fit well into contoured intermediate structures. (E) Scanning ion micrograph of mating Tetrahymena thermophila. (F) Brightfield image, ex situ. (G) SIMS image (128 × 128 pixels) for m/z 69 (C5H9+). (H) SIMS image for m/z 184 (PC), demonstrating lipid heterogeneity at the conjugation junction. SIMS images were acquired using a 200-nm beam spot size, resulting in an approximately 250-nm lateral resolution, as in previous work (16). Based on PC packing characteristics in a bilayer, each 1-μm2 pixel contained about 1.5 × 10⁶ PC molecules.

Line scans of the molecule-specific images graphically support the idea that PC decreases at the conjugation junction. Data points were collected every 120 nm. (A) Line scan for m/z 69 through the conjugation junction, illustrating that the total lipid content is relatively constant across the mating cells. The inset shows the SIMS image for m/z 69, highlighting the pixels used for the line scan. (B) Line scan for m/z 184 through the junction, demonstrating a sharp decrease in signal at the conjugation junction. The inset shows the SIMS image for m/z 184, highlighting the pixels used for the line scan.
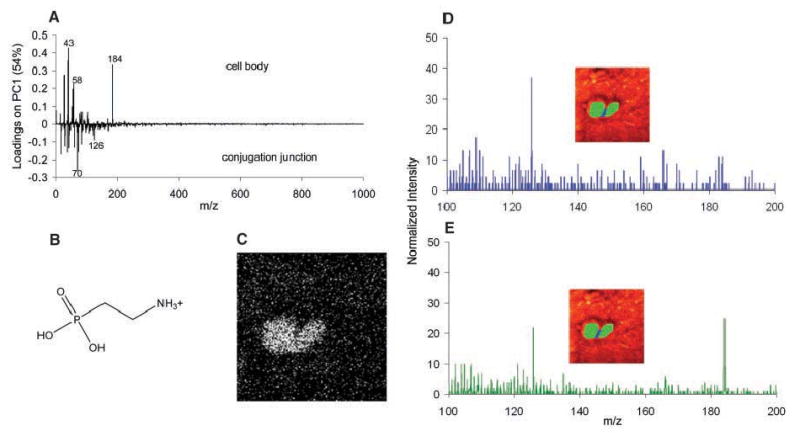
The conjugation junction contains elevated amounts of 2-AEP. Mass spectra from pixels were generated by selecting the pixels of interest using software written in house. (A) Loadings plot from principal component analysis comparing the mass spectra of the cell bodies and the conjugation junction. (B) 2-AEP headgroup fragment corresponding to m/z 126. (C) SIMS image for m/z 126. (D) Mass spectrum from the pixels along the conjugation junction, as indicated in the inset. (E) Mass spectrum from the pixels in the cell bodies, as indicated in the inset.
References
Publication types
MeSH terms
Substances
Grants and funding
LinkOut - more resources
Full Text Sources
Other Literature Sources
