. 2004 Jul;114(1):94-103.
doi: 10.1172/JCI20468.

PPARalpha governs glycerol metabolism

Affiliations

PPARalpha governs glycerol metabolism

David Patsouris et al. J Clin Invest. 2004 Jul.

Abstract

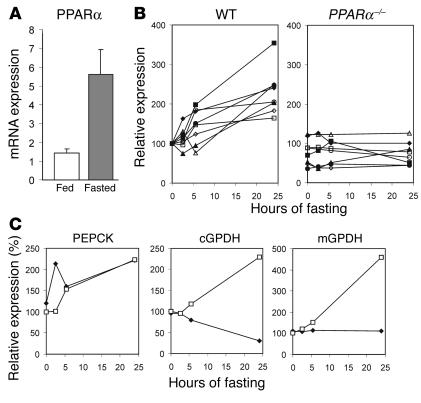
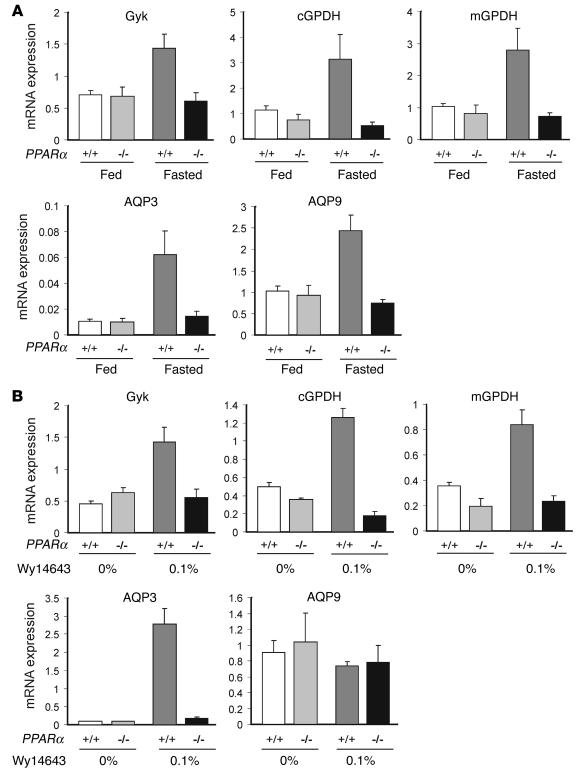
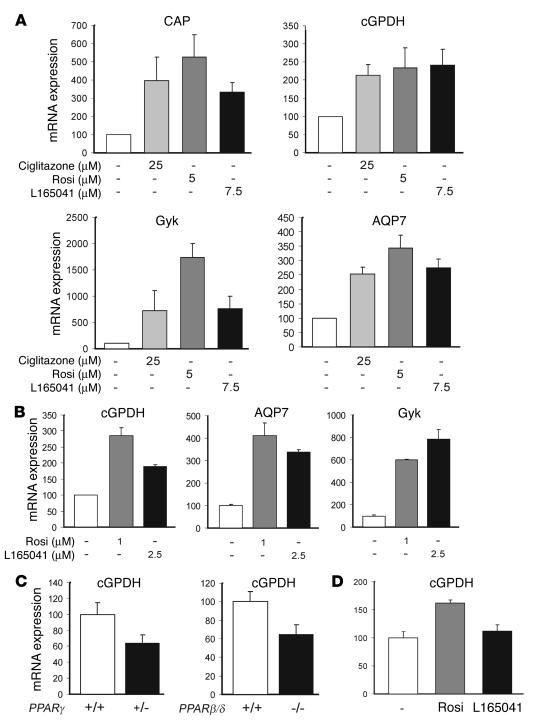
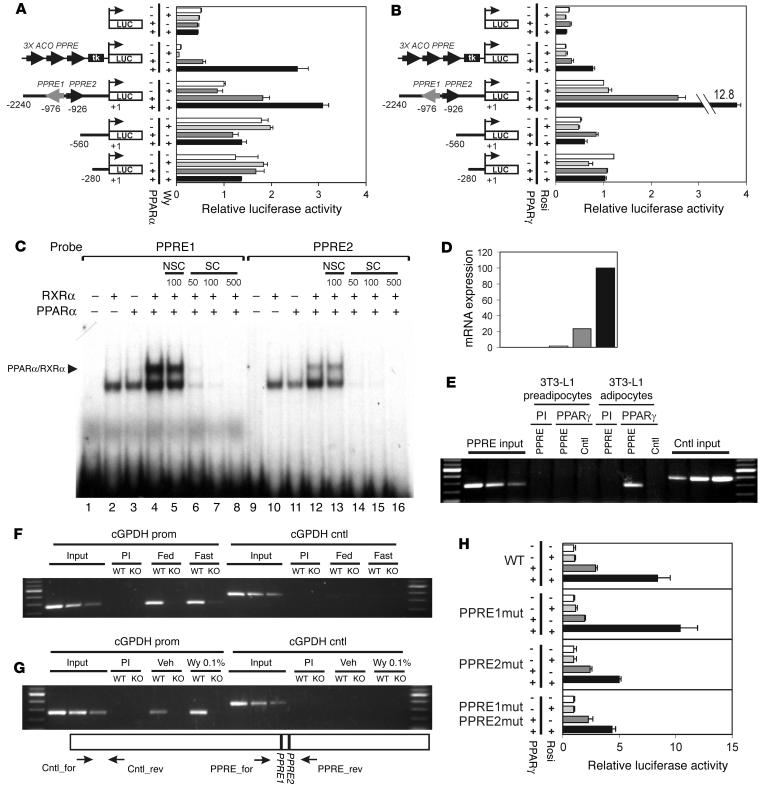
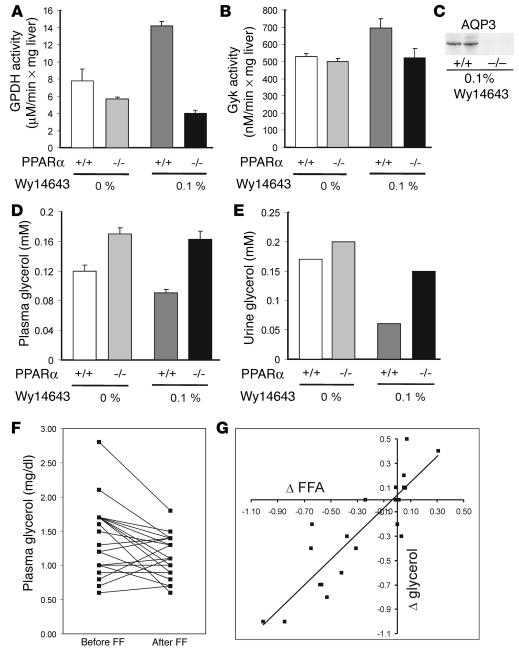
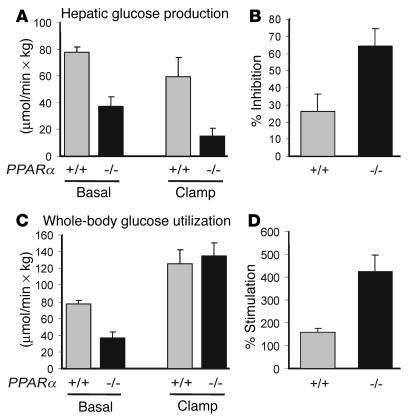
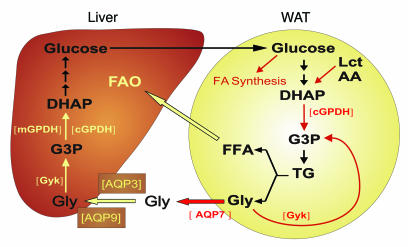
Glycerol, a product of adipose tissue lipolysis, is an important substrate for hepatic glucose synthesis. However, little is known about the regulation of hepatic glycerol metabolism. Here we show that several genes involved in the hepatic metabolism of glycerol, i.e., cytosolic and mitochondrial glycerol 3-phosphate dehydrogenase (GPDH), glycerol kinase, and glycerol transporters aquaporin 3 and 9, are upregulated by fasting in wild-type mice but not in mice lacking PPARalpha. Furthermore, expression of these genes was induced by the PPARalpha agonist Wy14643 in wild-type but not PPARalpha-null mice. In adipocytes, which express high levels of PPARgamma, expression of cytosolic GPDH was enhanced by PPARgamma and beta/delta agonists, while expression was decreased in PPARgamma(+/-) and PPARbeta/delta(-/-) mice. Transactivation, gel shift, and chromatin immunoprecipitation experiments demonstrated that cytosolic GPDH is a direct PPAR target gene. In line with a stimulating role of PPARalpha in hepatic glycerol utilization, administration of synthetic PPARalpha agonists in mice and humans decreased plasma glycerol. Finally, hepatic glucose production was decreased in PPARalpha-null mice simultaneously fasted and exposed to Wy14643, suggesting that the stimulatory effect of PPARalpha on gluconeogenic gene expression was translated at the functional level. Overall, these data indicate that PPARalpha directly governs glycerol metabolism in liver, whereas PPARgamma regulates glycerol metabolism in adipose tissue.


Figures

Figure 1
Figure 1
Oligonucleotide microarray analysis identifies novel putative PPARα target genes. (A) Relative expression of PPARα in liver was determined by Q-PCR in fed and 24-hour-fasted mice (n = 4). The difference was evaluated by Student’s t test (P < 0.01). Error bars represent SEM. (B) Expression of genes involved in fatty acid oxidation and ketogenesis in livers of wild-type and PPARα-null mice, as determined by oligonucleotide microarray (Affymetrix). The average difference (expression) of wild-type at 0 hours was arbitrarily set at 100. Filled diamonds: long-chain fatty acyl-CoA synthetase; open diamonds: carnitine palmitoyltransferase II; filled triangles: long-chain acyl-CoA dehydrogenase; open circles: short-chain acyl-CoA dehydrogenase; open triangles: medium-chain acyl-CoA dehydrogenase; filled circles: dodecenoyl-CoA δ-isomerase; filled squares: HMG-CoA synthase; open squares: HMG-CoA lyase. (C) Hepatic expression of PEPCK (left), cGPDH (middle) and mGPDH (right) after 0, 2.5, 5.5 and 24 hours fasting in wild-type and PPARα-null mice according to oligonucleotide microarray. The average difference (expression) of wild-type at 0 hours was arbitrarily set at 100.
Figure 2
Figure 2
PPARα upregulates the expression of numerous genes involved in the conversion of glycerol to glucose. (A) Relative expression of glycerol kinase (Gyk), cGPDH, mGPDH, AQP3, and AQP9 were determined by Q-PCR in fed and 24-hour-fasted wild-type and PPARα-null mice. Statistically significant effects were observed by two-way ANOVA for all genes for genotype (P < 0.01), and for the interaction between genotype and feeding status (P < 0.05). (B) Relative expression of Gyk, cGPDH, mGPDH, AQP3, and AQP9 were determined by Q-PCR in wild- type and PPARα-null mice after feeding with Wy14643. Statistically significant effects were observed by two-way ANOVA for all genes for genotype and for Wy14643 treatment, and for the interaction between the two parameters (P < 0.01), except for AQP9. Error bars represent SEM.
Figure 3
Figure 3
PPARγ and PPARβ/δ agonists induce cGPDH gene expression in adipocytes. (A) 3T3-L1 adipocytes at day 10 of differentiation were treated with the PPARγ agonists ciglitazone (25 μM) or rosiglitazone (Rosi) (5 μM), or the PPARβ agonist L165041 (7.5 μM), and mRNA expression of the indicated genes was determined by Q-PCR. Results are expressed as percentage of control (DMSO). One-way ANOVA indicated that differences in expression were statistically significant for all four genes (P < 0.05). (B) Human SGBS adipocytes at day 13 of differentiation were treated with PPARγ agonist rosiglitazone (1 μM) or PPARβ agonists L165041 (2.5 μM). Expression of the indicated genes was determined by Q-PCR. One-way ANOVA indicated that differences in expression were statistically significant for all three genes (P < 0.05). (C) Expression of cGPDH in WAT of PPARγ+/– and PPARβ/δ–/– mice, as determined by Q-PCR. Differences were statistically significant (Student’s t test, P < 0.05). (D) Expression of cGPDH in WAT of wild-type mice fed 0.01% rosiglitazone or 0.025% L165041, as determined by Q-PCR. The effect of rosiglitazone was statistically significant (Student’s t test, P < 0.01). Error bars represent SEM.
Figure 4
Figure 4
cGPDH is a direct PPARα/γ target gene. Mouse cGPDH reporter constructs containing 2240, 560, or 280 bp of immediate upstream promoter region were transfected into NIH-3T3 cells together with a PPARα (A) or PPARγ (B) expression vector. Normalized activity of the full-length cGPDH reporter in the absence of PPAR and ligands was set at 1. (C) Binding of the PPAR/RXR heterodimer to putative response elements, as determined by electrophoretic mobility shift assay. The double-stranded response elements cGPDH-PPRE1 (lanes 1–8). Fold-excess of specific (SC) or nonspecific (NSC) cold probe is indicated. (D) Expression of cGPDH during 3T3-L1 adipogenesis as determined by Q-PCR. Expression at day 8 was set at 100%. ChIP of PPRE within mouse cGPDH promoter using anti-mPPARγ or anti-mPPARα antibodies. Gene sequences spanning the putative PPREs (+1020 to +782) and a random control sequence (+2519 to +2124) were analyzed by PCR in the immunoprecipitated chromatin of 3T3-L1 preadipocytes and adipocytes (E), fed and fasted wild-type and PPARα-null mice (F), and wild-type and PPARα-null mice treated or not with Wy14643 (G). Preimmune serum was used as a control. (H) Transcriptional activity of site-directed mutants (mut) of the cGPDH promoter. Mouse cGPDH reporter constructs containing double nucleotide changes in PPRE1, PPRE2, or both, were transfected into HepG2 cells together with a PPARγ expression vector. Normalized activity of the reporter in the absence of PPAR and ligand was set at 1. Error bars in A, B, and H represent SEM. Cntl, random control sequence; PI, preimmune serum; prom, promoter; Veh, vehicle; Wy, Wy14643; for, forward primer; rev, reverse primer.
Figure 5
Figure 5
PPARα activation decreases plasma and urine glycerol levels. Enzyme activity of GPDH (A) or glycerol kinase (B) was determined in liver homogenates of wild-type and PPARα-null mice after feeding with Wy14643 (n = 4 per group). Error bars represent SEM. (C) AQP3 protein was determined by Western blot in the membrane fraction of liver homogenates of wild-type and PPARα-null mice treated with Wy14643. Equal amounts of protein were loaded. Glycerol was determined in plasma (D) (n = 4) and urine (E) (samples in each group were pooled and determined in duplicate) in wild-type and PPARα-null mice after feeding with Wy14643. Significant effects were observed by two-way ANOVA for genotype and for Wy14643 treatment (P < 0.05). (F) Plasma glycerol levels decreased in atherosclerotic patients after 4-week treatment with micronized fenofibrate (FF) (250 mg/day). (P < 0.01, paired Student’s t test) (G) Correlation between changes in plasma free fatty acids (FFA) and glycerol in atherosclerotic patients treated with fenofibrate.
Figure 6
Figure 6
Decreased hepatic glucose production and increased insulin sensitivity in PPARα-null mice. Wild-type and PPARα-null mice administered Wy14643 and fasted were analyzed by hyperinsulinemic clamp technique. (A) Hepatic glucose production under basal and hyperinsulinemic conditions. (B) Percentage of inhibition of hepatic glucose production by insulin. (C) Whole-body glucose utilization under basal and hyperinsulinemic conditions. (D) Percentage of stimulation of whole-body glucose utilization by insulin. Differences between genotypes were statistically significant for all variables except glucose utilization under hyperinsulinemic conditions. P < 0.05, Mann-Whitney U test. Error bars represent SEM.
Figure 7
Figure 7
Proposed model integrating the roles of PPARα and PPARγ in glycerol (Gly) metabolism. Adipose tissue releases FFAs and glycerol. FFAs released by adipose tissue ligand-activate PPARα, whose hepatic expression is increased during fasting. Activation of PPARα induces expression of AQP3 and AQP9, which enable glycerol to enter the hepatocytes. Activation of PPARα also induces the expression of glycerol kinase, cGPDH, and mGPDH, which participate in the conversion of glycerol to glucose. In adipose tissue, PPARγ induces the expression of genes promoting the conversion of glucose to FFAs, as well as the conversion of glucose to glycerol 3-phosphate (G3P) from glucose. Glycerol 3-phosphate serves as the direct precursor for triglyceride (TG) synthesis. Moreover, PPARγ stimulates glycerol transport, glyceroneogenesis, and glycerol phosphorylation. Pathways regulated by PPARα are indicated in yellow, whereas those regulated by PPARγ are indicated in red. DHAP, dihydroxyacetonephosphate; Lct, lactate; FAO, fatty acid oxidation. Brackets indicate enzymes.

Similar articles

Cited by

References

    1. Bergman RN, Ader M. Free fatty acids and pathogenesis of type 2 diabetes mellitus. Trends Endocrinol. Metab. 2000;11:351–356. - PubMed
    1. Chen X, Iqbal N, Boden G. The effects of free fatty acids on gluconeogenesis and glycogenolysis in normal subjects. J. Clin. Invest. 1999;103:365–372. - PMC - PubMed
    1. Gonzalez-Manchon C, Martin-Requero A, Ayuso MS, Parrilla R. Role of endogenous fatty acids in the control of hepatic gluconeogenesis. Arch. Biochem. Biophys. 1992;292:95–101. - PubMed
    1. Lam TK, et al. Mechanisms of the free fatty acid-induced increase in hepatic glucose production. Am. J. Physiol. Endocrinol. Metab. 2003;284:E863–E873. - PubMed
    1. Rebrin K, Steil GM, Getty L, Bergman RN. Free fatty acid as a link in the regulation of hepatic glucose output by peripheral insulin. Diabetes. 1995;44:1038–1045. - PubMed

Publication types

MeSH terms