. 2004 Jul;114(1):104-11.
doi: 10.1172/JCI19569.

Extravascular fibrin, plasminogen activator, plasminogen activator inhibitors, and airway hyperresponsiveness

Affiliations

Extravascular fibrin, plasminogen activator, plasminogen activator inhibitors, and airway hyperresponsiveness

Scott S Wagers et al. J Clin Invest. 2004 Jul.

Abstract

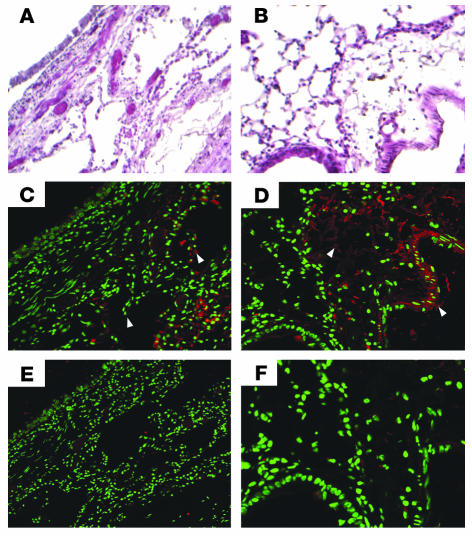
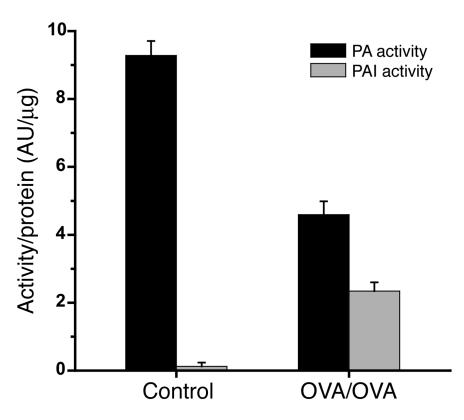
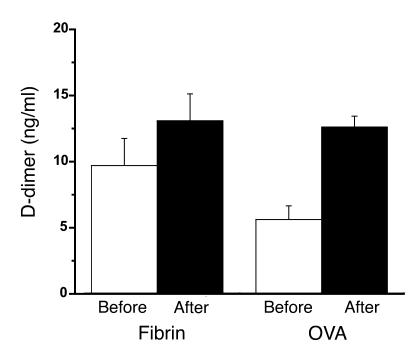
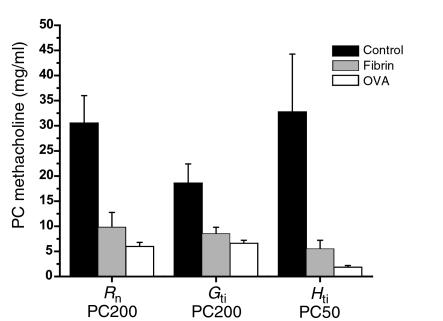
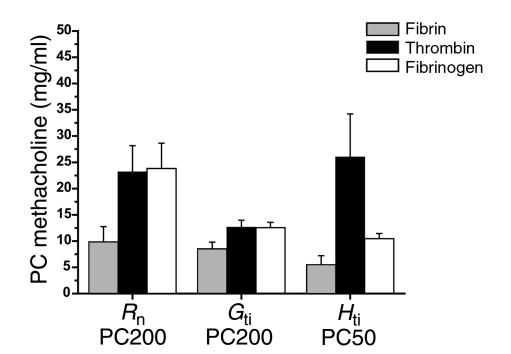
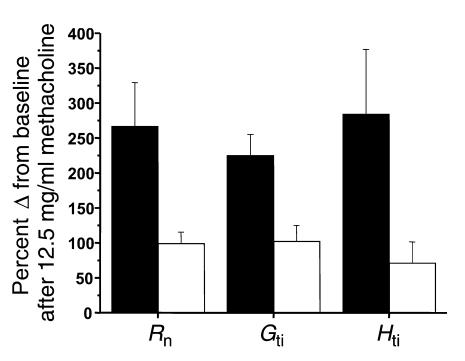
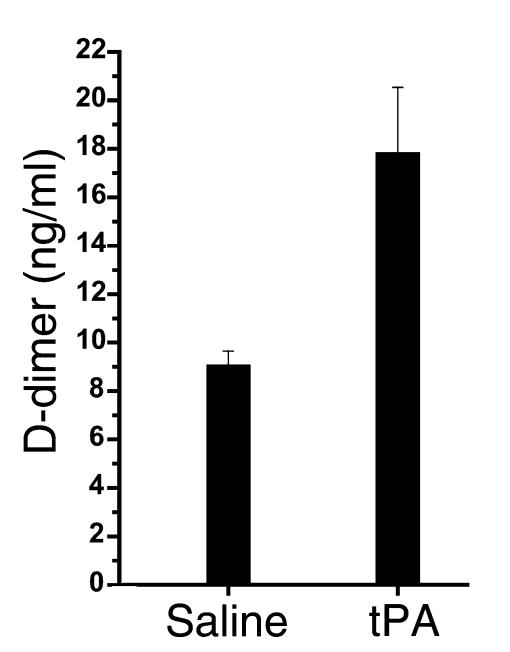
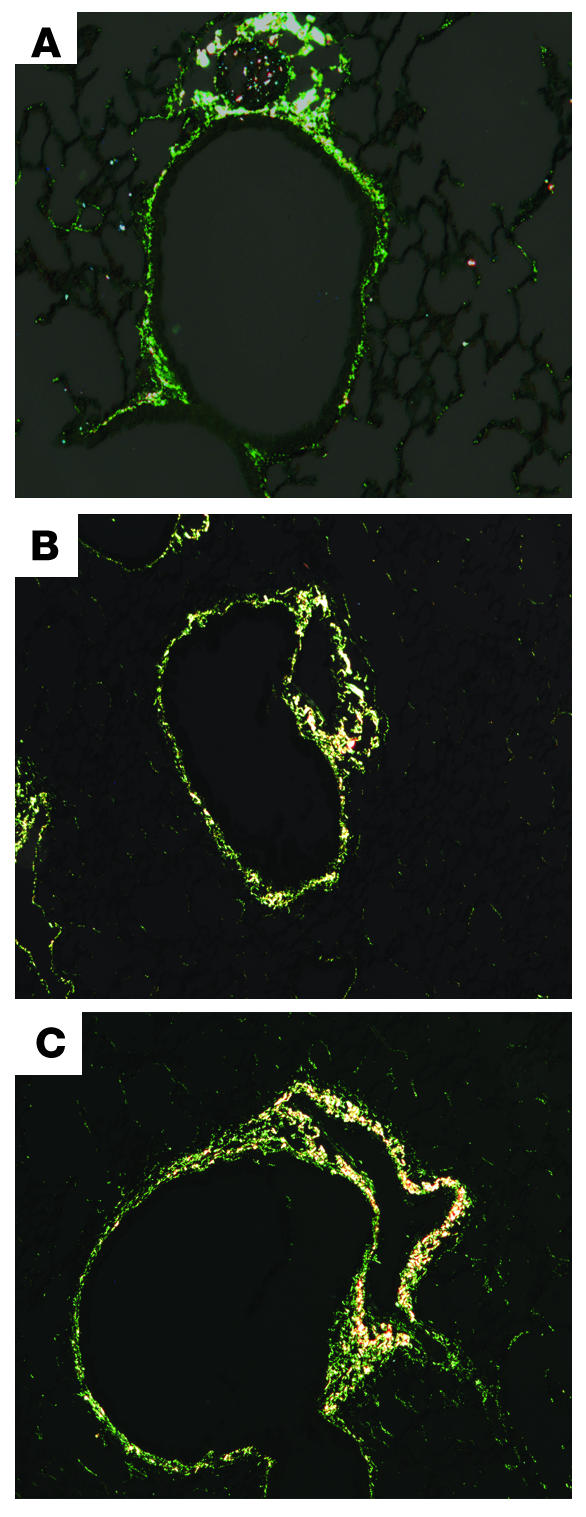
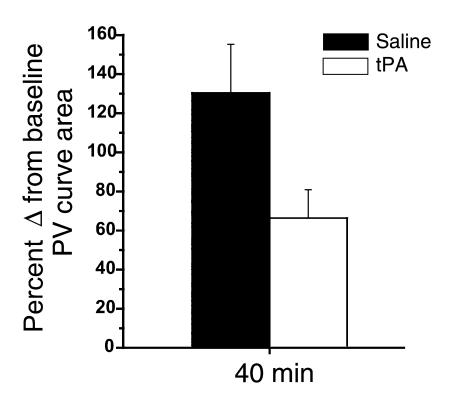
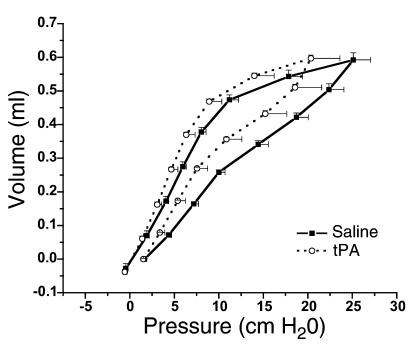
Mechanisms underlying airway hyperresponsiveness are not yet fully elucidated. One of the manifestations of airway inflammation is leakage of diverse plasma proteins into the airway lumen. They include fibrinogen and thrombin. Thrombin cleaves fibrinogen to form fibrin, a major component of thrombi. Fibrin inactivates surfactant. Surfactant on the airway surface maintains airway patency by lowering surface tension. In this study, immunohistochemically detected fibrin was seen along the luminal surface of distal airways in a patient who died of status asthmaticus and in mice with induced allergic airway inflammation. In addition, we observed altered airway fibrinolytic system protein balance consistent with promotion of fibrin deposition in mice with allergic airway inflammation. The airways of mice were exposed to aerosolized fibrinogen, thrombin, or to fibrinogen followed by thrombin. Only fibrinogen followed by thrombin resulted in airway hyperresponsiveness compared with controls. An aerosolized fibrinolytic agent, tissue-type plasminogen activator, significantly diminished airway hyperresponsiveness in mice with allergic airway inflammation. These results are consistent with the hypothesis that leakage of fibrinogen and thrombin and their accumulation on the airway surface can contribute to the pathogenesis of airway hyperresponsiveness.


Figures

Figure 1
Figure 1
Fibrin immunostaining. H&E staining of a human lung from a patient who died due to status asthmaticus (A) (magnification ×10) and a lung from a mouse with allergic airway inflammation (B) (magnification ×20) are shown as a structural reference for the immunostaining. Immunostaining with a mouse IgG that selectively binds to the β chain of both mouse and human fibrin is shown (C and D). Red reaction product indicating the presence of fibrin (white arrowheads) is seen within the parenchyma and airways in both the human and mouse lung sections. Immunostaining in which a nonspecific mouse IgG was used is shown as an isotype control (E and F).
Figure 2
Figure 2
PAI activity in lung tissue homogenates of mice with airway inflammation. PAI activity with respect to protein content was significantly increased in mice with allergic airway inflammation (n = 9) compared with controls (n = 9): 2.34 ± 0.3 AU/μg compared with 0.12 ± 0.1 AU/μg, P < 0.01. A concurrent decrease in PA activity was observed in mice with allergic airway inflammation compared with controls: 9.28 ± 0.4 AU/μg compared with 4.6 ± 0.4 AU/μg, P < 0.01.
Figure 3
Figure 3
Quantification of fibrin. Relative amounts of intact fibrin were determined by subjecting the lavage samples to fibrin digestion with plasmin. The graph depicts predigestion (Before) and postdigestion (After) concentrations of D-dimer in lavage fluid. Mice that been exposed to nebulized fibrinogen followed by thrombin (Fibrin) (n = 8) are compared with mice that had allergic airway inflammation (OVA) (n = 10). Predigestion D-dimer concentrations are the highest in the fibrin mice (9.7 ± 2.1; 5.61 ± 1.0). Postdigestion concentration of D-dimer in BAL from OVA mice (12.6 ± 0.8) was similar to postdigestion D-dimer concentration in fibrin mice (13.1 ± 2.0). OVA mice had a larger difference between postdigestion and predigestion BAL D-dimer concentration (7.0 ± 1.4) compared with BAL from fibrin mice (3.39 ± 2.7). This indicates that greater amounts of intact fibrin is present on the airway surface of OVA mice.
Figure 4
Figure 4
Effect of fibrinogen followed by thrombin on airway hyperresponsiveness. Mice that received fibrinogen followed by thrombin (n = 7) had significantly increased airway hyperresponsiveness in terms of all parameters compared with mice that received saline alone (n = 7): Rn (saline alone, 30.5 ± 5.5, versus fibrinogen followed by thrombin, 9.8 ± 2.9; P < 0.01), Gti (saline alone, 18.5 ± 3.8, versus fibrinogen followed by thrombin, 8.5 ± 1.3; P < 0.01), and Hti (saline alone, 32.7 ± 12, versus fibrinogen followed by thrombin, 5.5 ± 1.7; P < 0.01). The degree of airway hyperresponsiveness seen in fibrinogen followed by thrombin mice was similar to that seen in mice with allergic airway inflammation (OVA) (n = 10): Rn (fibrinogen followed by thrombin, 9.8 ± 2.9, versus OVA, 5.95 ± 0.82), Gti (fibrinogen followed by thrombin, 8.5 ± 1.3, versus OVA, 6.57 ± 0.64), Hti (fibrinogen followed by thrombin, 5.5 ± 1.7, versus OVA, 1.83 ± 0.37).
Figure 5
Figure 5
Effect of fibrinogen or thrombin alone on airway hyperresponsiveness. Mice given nebulized fibrinogen followed by thrombin (n = 7) had significantly increased airway hyperresponsiveness to methacholine in all parameters compared with mice that received fibrinogen alone (n = 6) or thrombin alone (n = 6): Rn (fibrinogen followed by thrombin, 9.8 ± 2.9; fibrinogen alone, 23.8 ± 4.8, P < 0.03; thrombin alone, 23.2 ± 5.0, P < 0.04), Gti (fibrinogen followed by thrombin, 8.5 ± 1.3; fibrinogen alone, 12.5 ± 1.0, P < 0.04; thrombin alone, 12.6 ± 1.3, P < 0.05), Hti (fibrinogen followed by thrombin, 5.5 ± 1.7; fibrinogen alone, 10.4 ± 1.0, P < 0.04; thrombin alone, 26 ± 8.2, P < 0.03).
Figure 6
Figure 6
The effect of nebulized fibrinolytic agent, tPA, on the response to methacholine in mice with allergic airway inflammation. The response to a single dose of 12.5 mg/ml of nebulized methacholine administered 15 minutes after administration of saline (black bars) or tPA (white bars) is shown on the ordinate as the percentage of increase from baseline. An increased value indicates an increased response to methacholine. Mice with allergic airway inflammation (n = 7) that had been exposed to tPA had a significantly reduced response to methacholine compared with those exposed to saline alone (n = 7): Rn, 99.2% ± 16% compared with 267% ± 62% (P < 0.03); Gti, 102% ± 23% compared with 225% ± 30% (P < 0.01); and Hti, 71% ± 30% compared with 284% ± 92% (P < 0.05). In terms of Rn and Gti, the response to methacholine in mice with airway inflammation that had been exposed to nebulized tPA (n = 7) was similar to the response in mice without airway inflammation exposed to saline (n = 10): Rn, 99.2% ± 16% compared with 119% ± 14%; Gti, 102% ± 23% compared with 137% ± 21%. Nebulized tPA did not completely reduce the response in terms of Hti to the level seen in controls: 71.2% ± 30% compared with 25.6% ± 2.7%.
Figure 7
Figure 7
Concentrations of fibrin degradation products (D-dimer) in the BAL fluid of mice that had been exposed to aerosolized tPA. The concentration of D-dimer increased significantly in the BAL from mice with airway inflammation exposed to tPA (n = 9) compared with those exposed to saline (n = 8, 17.8 ± 2.7 ng/ml compared with 9.05 ± 0.6 ng/ml).
Figure 8
Figure 8
Subepithelial fibrosis in mice with allergic airway inflammation. Staining with Sirius red of lung sections from naive BALB/c mice (A) and those with allergic airway inflammation (B) is shown. Sirius red is a dye that stains collagen specifically. Scoring by masked observers demonstrated a significant increase in subepithelial collagen deposition in mice with allergic airway inflammation (score: 1.14 ± 0.1 naive, n = 7; 1.96 ± 0.26 inflamed, n = 8; P < 0.01). Inflamed mice that received nebulized tPA (C) showed no reduction in subepithelial collagen deposition compared with inflamed mice that received saline only (score: 1.96 ± 0.2, n = 8, inflamed + tPA; 1.96 ± 0.26, n = 8, inflamed + saline).
Figure 9
Figure 9
The effect of the fibrinolytic agent, tPA, on PV curve hysteresis in mice with inflamed airways. The percentage of increase in the area subtended by the inspiratory and expiratory limb of a PV curve obtained 40 minutes after nebulization of saline or tPA was determined for each individual mouse, and results from all mice in each group were then averaged. Mice exposed to tPA (n = 6) had significantly smaller PV curve areas compared with those in mice exposed to saline alone (n = 9): 66.3% ± 15% compared with 130% ± 25%.
Figure 10
Figure 10
PV curves from mice with allergic airway inflammation that had been exposed to saline or tPA. PV curves that were generated with a stepwise volume insufflation of an in vivo mouse preparation are shown here with pressure on the abscissa and volume on the ordinate. Mice exposed to tPA exhibited curves characterized by lower pressures at each volume increment. The inspiratory curve is shifted to the left in the mice exposed to tPA, demonstrating an increase in lung compliance consistent with enhanced function of surfactant.

Comment in

Similar articles

Cited by

References

    1. McLane MP, et al. Interleukin-9 promotes allergen-induced eosinophilic inflammation and airway hyperresponsiveness in transgenic mice. Am. J. Respir. Cell Mol. Biol. 1998;19:713–720. - PubMed
    1. Foster PS, Hogan SP, Ramsay AJ, Matthaei KI, Young IG. Interleukin 5 deficiency abolishes eosinophilia, airways hyperreactivity, and lung damage in a mouse asthma model. J. Exp. Med. 1996;183:195–201. - PMC - PubMed
    1. Wills-Karp M, et al. Interleukin-13: central mediator of allergic asthma. Science. 1998;282:2258–2261. - PubMed
    1. Roberts JA, Raeburn D, Rodger IW, Thomson NC. Comparison of in vivo airway responsiveness and in vitro smooth muscle sensitivity to methacholine in man. Thorax. 1984;3:837–843. - PMC - PubMed
    1. O’Byrne PM, Dolovich M, Dirks R, Roberts RS, Newhouse MT. Lung epithelial permeability: relation to nonspecific airway responsiveness. J. Appl. Physiol. 1984;57:77–84. - PubMed

Publication types

MeSH terms