. 2004 Sep 15;382(Pt 3):849-56.
doi: 10.1042/BJ20040979.

Extracellular NAD+ regulates intracellular free calcium concentration in human monocytes

Affiliations

Extracellular NAD+ regulates intracellular free calcium concentration in human monocytes

Anja Gerth et al. Biochem J. .

Abstract

Ca(2+) ions play a critical role in the biochemical cascade of signal transduction pathways, leading to the activation of immune cells. In the present study, we show that the exposure of freshly isolated human monocytes to NAD(+) results in a rapid concentration-dependent elevation of [Ca(2+)](i) (intracellular free Ca(2+) concentration) caused by the influx of extracellular Ca(2+). NAD(+) derivatives containing a modified adenine or nicotinamide ring failed to trigger a Ca(2+) increase. Treating monocytes with ADPR (ADP-ribose), a major degradation product of NAD(+), also resulted in a rise in [Ca(2+)](i). Selective inhibition of CD38, an NAD-glycohydrolase that generates free ADPR from NAD(+), does not abolish the effect of NAD(+), excluding the possibility that NAD(+) might act via ADPR. The NAD(+)-induced Ca(2+) response was prevented by the prior addition of ADPR and vice versa, indicating that both compounds share some mechanisms mediating the rise in [Ca(2+)](i). NAD(+), as well as ADPR, were ineffective when applied following ATP, suggesting that ATP controls events that intersect with NAD(+) and ADPR signalling.


Figures

Figure 1
Figure 1. NAD+ induces a rise in cytosolic Ca2+ in human monocytes
(A) Representative trace of an increase in intracellular Ca2+ following application of NAD+ (200 μM, open bar) (n=31). Shown is the 340 nm/380 nm emission ratio from one out of 20 experiments. (B) Dose-dependent effect of NAD+ on [Ca2+]i measured as the change in the 340 nm/380 nm emission ratio. Results are means±S.E.M. (n=15–39 cells) of one out of three experiments.
Figure 2
Figure 2. NAD+-induced rise in [Ca2+]i depends on extracellular Ca2+
(A) Monocytes were incubated with NAD+ (200 μM) in a Ca2+-containing or Ca2+-free solution. Results are means±S.E.M. (n=35–49 cells) of one out of three experiments. ***P<0.001 compared with control (Ca2+-containing solution); Student's t test. (B) Monocytes were pre-incubated with LaCl3 (1 mM) or BaCl2 (2 mM) for 30 min before NAD+ (200 μM) was added. Results are means±S.E.M. (n=20–55 cells) of one out of three experiments. ***P<0.001 compared with control (in the absence of LaCl3 or BaCl2); Student's t test.
Figure 3
Figure 3. NAD+-induced uptake of Mn2+
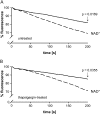
Monocytes were loaded with fura 2/AM in the absence (A) and presence (B) of thapsigargin (0.3 μM). Fluorescence monitoring at an emission wavelength of 360 nm was performed for 200 s starting with the addition of MnCl2 (0.6 mM) for 20 s before the addition of NAD+ (200 μM). A fluorescence value of 100% refers to the 360 nm values obtained immediately before the addition of NAD+. (A) Values measured after 200 s in the absence of NAD+ were 83% and in the presence of NAD+ 72% (P=0.0169; n=5; Student's t test). (B) Values measured after 200 s in the presence of thapsigargin were 85%, and in the presence of thapsigargin and NAD+ were 71% (P=0.0355; n=5; Student's t test).
Figure 4
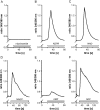
Figure 4. Effects of nicotinamide, ADPR, NAD+, NADP+, AMP and ADP on the [Ca2+]i in monocytes
Cells were incubated with 200 μM of the following compounds (open bar): (A) nicotinamide, (B) ADPR, (C) NAD+, (D) NADP+, (E) AMP or (F) ADP, and the intracellular Ca2+ levels were measured as the 340 nm/380 nm emission ratio. Representative traces (n=30–60 cells) from one out of three experiments are shown.
Figure 5
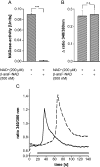
Figure 5. Effect of β-araF-NAD and β-riboF-NAD on the [Ca2+]i in monocytes. β-araF-NAD inhibits NAD+ glycohydrolase activity
(A) Cells were incubated with NAD+ (200 μM) in the presence and absence of β-araF-NAD (500 nM) for 30 min, and the cyanide complex of NAD+ in the supernatant was measured at 325 nm. Units are the decrease in absorbance per h per 106 cells. Results are the means±S.E.M. of three separate experiments. ***P<0.001 compared with control (in the absence of β-araF-NAD). (B) Cells were incubated in the presence and absence of β-araF-NAD (500 nM) for 30 min before the addition of NAD+ (200 μM). Intracellular Ca2+ levels were measured as the change in the 340 nm/380 nm emission ratio. Results are means±S.E.M. of three experiments (n=25–35 cells). n.s., not significant. (C) Representative trace of an increase in intracellular Ca2+ following application of NAD+ (200 μM, solid line, open bar) or β-riboF-NAD (200 μM, broken line, open bar) (n=25). The 340 nm/380 nm emission ratio from one out of three experiments is shown.
Figure 6
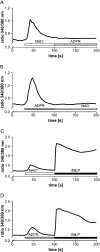
Figure 6. NAD+ (followed by ADPR) treatment prevents stimulation with ADPR (NAD+), but not with fMLP
Monocytes were treated with NAD+ (200 μM, open bar) (A and C) or ADPR (200 μM, grey bar) (B and D) before the addition of ADPR (200 μM, grey bar) (A) or NAD+ (200 μM, open bar) (B) or fMLP (1 μM, black bar) (C and D). Intracellular Ca2+ levels were measured as the 340 nm/380 nm emission ratio. Representative traces (n=40–45 cells) from one out of three experiments are shown.
Figure 7
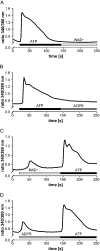
Figure 7. ATP prevents stimulation with NAD+ (followed by ADPR)
Monocytes were treated with 100 μM ATP (A and B, black bar) before the addition of 200 μM NAD+ (A, open bar) and 200 μM ADPR (B, grey bar) or with 200 μM NAD+ (C, open bar) and 200 μM ADPR (D, grey bar) before the addition of 100 μM ATP (C and D, black bar). Intracellular Ca2+ levels were measured as the 340 nm/380 nm emission ratio. Representative traces (n=45–60 cells) from one out of three experiments are shown.
Figure 8
Figure 8. Effects of ATP, NAD+ and ADPR on ethidium bromide uptake in human monocytes
Monocytes were suspended in potassium glutamate basic salt solution in the presence of 2.5 μM ethidium bromide. The cells were incubated with 2 mM ATP (A), 2 mM NAD+ (B) or 2 mM ADPR (C) for 15 min at 37 °C, and washed twice with PBS. Ethidium bromide uptake was measured by FACS analysis. Traces from one out of two independent experiments are shown.

Comment in

  • NAD+ surfaces again.
    Ziegler M, Niere M. Ziegler M, et al. Biochem J. 2004 Sep 15;382(Pt 3):e5-6. doi: 10.1042/BJ20041217. Biochem J. 2004. PMID: 15352307 Free PMC article. Review.

Similar articles

Cited by

References

    1. Wang J., Nemoto E., Kots A. Y., Kaslow H. R., Dennert G. Regulation of cytotoxic T cells by ecto-nicotinamide adenine dinucleotide (NAD) correlates with cell surface GPI-anchored/arginine ADP-ribosyltransferase. J. Immunol. 1994;153:4048–4058. - PubMed
    1. Liu Z. X., Azhipa O., Okamoto S., Govindarajan S., Dennert G. Extracellular nicotinamide adenine dinucleotide induces T cell apoptosis in vivo and in vitro. J. Immunol. 2001;167:4942–4947. - PubMed
    1. Adriouch S., Ohlrogge W., Haag F., Koch-Nolte F., Seman M. Rapid induction of naive T cell apoptosis by ecto-nicotinamide adenine dinucleotide: requirement for mono(ADP-ribosyl)transferase 2 and a downstream effector. J. Immunol. 2001;167:196–203. - PubMed
    1. Bortell R., Moss J., McKenna R. C., Rigby M. R., Niedzwiecki D., Stevens L. A., Patton W. A., Mordes J. P., Greiner D. L., Rossini A. A. Nicotinamide adenine dinucleotide (NAD) and its metabolites inhibit T lymphocyte proliferation: role of cell surface NAD glycohydrolase and pyrophosphatase activities. J. Immunol. 2001;167:2049–2059. - PubMed
    1. Dubyak G. R. Role of P2 receptors in the immune system. In: Abbracchio M. P., Williams M., editors. Handbook of Experimental Pharmacology: Purinergic and Pyrimidinergic Signalling, vol. 151/II. Berlin: Springer-Verlag; 2001. p. 323.

Publication types