Comparative Study
. 2004 Aug 15;559(Pt 1):169-86.
doi: 10.1113/jphysiol.2004.068858. Epub 2004 Jul 2.

Role of glial and neuronal glycine transporters in the control of glycinergic and glutamatergic synaptic transmission in lamina X of the rat spinal cord

Affiliations
Comparative Study

Role of glial and neuronal glycine transporters in the control of glycinergic and glutamatergic synaptic transmission in lamina X of the rat spinal cord

Amyaouch Bradaïa et al. J Physiol. .

Erratum in

  • J Physiol. 2004 Sep 15;559(Pt 3):985

Abstract

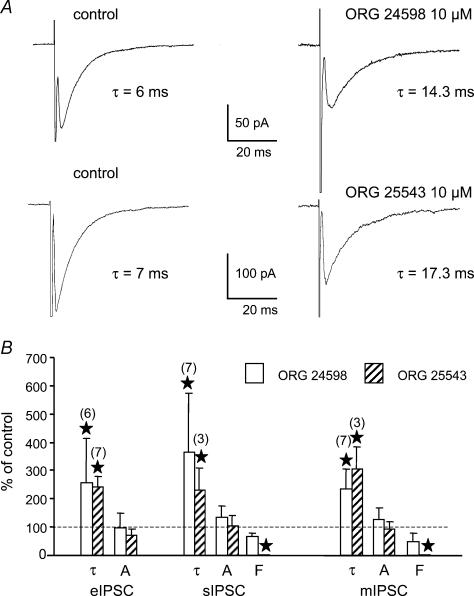
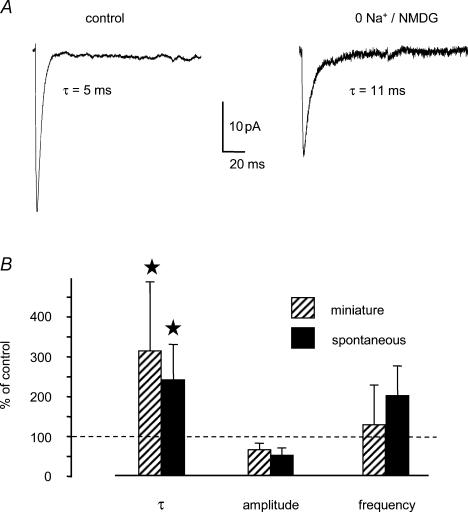
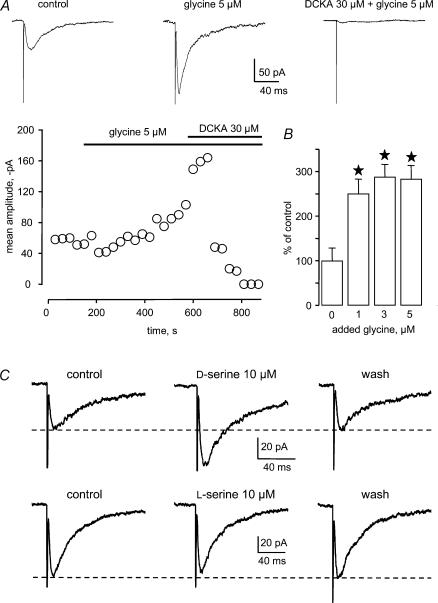
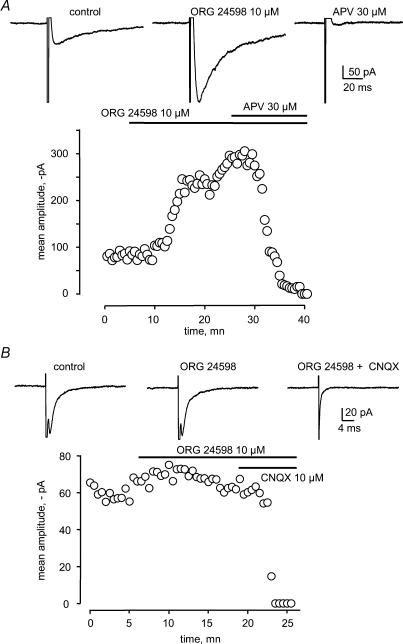
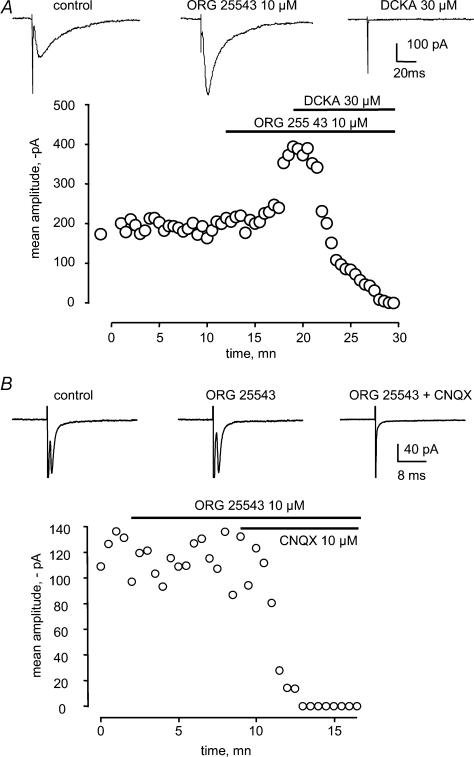
Using whole cell voltage clamp recordings from lamina X neurones in rat spinal cord slices, we investigated the effect of glycine transporter (GlyT) antagonists on both glycinergic inhibitory postsynaptic current (IPSCs) and glutamatergic excitatory postsynaptic current (EPSCs). We used ORG 24598 and ORG 25543, selective antagonists of the glial GlyT (GlyT1) and neuronal GlyT (GlyT2), respectively. In rats (P12-P16) and in the presence of kynurenic acid, 6-cyano-7-nitroquinoxaline-2,3-dione (CNQX) and bicuculline, ORG 24598 and ORG 25543 applied individually at a concentration of 10 microm induced a mean inward current of -10/-50 pA at -60 mV and increased significantly the decay time constants of miniature (mIPSCs), spontaneous (sIPSCs) and electrically evoked glycinergic (eIPSCs) inhibitory postsynaptic currents. ORG 25543, but not ORG 24598, decreased the frequency of mIPSCs and sIPSCs. Replacing extracellular sodium with N-methyl-d-glucamine or superfusing the slice with micromolar concentrations of glycine also increased the decay time constant of glycinergic IPSCs. By contrast, the decay time constant, amplitude and frequency of miniature GABAergic IPSCs recorded in the presence of strychnine were not affected by ORG 24598 and ORG 25543. In the presence of strychnine, bicuculline and CNQX, we recorded electrically evoked NMDA receptor-mediated EPSCs (eEPSCs). eEPSCs were suppressed by 30 micromd-2-amino-5-phosphonovalerate (APV), an antagonist of the NMDA receptor, and by 30 microm dichlorokynurenic acid (DCKA), an antagonist of the glycine site of the NMDA receptor. Glycine (1-5 microm) and d-serine (10 microm) increased the amplitude of eEPSCs whereas l-serine had no effect. ORG 24598 and ORG 25543 increased significantly the amplitude of NMDA receptor-mediated eEPSCs without affecting the amplitude of non-NMDA receptor-mediated eEPSCs. We conclude that blocking glial and/or neuronal glycine transporters increased the level of glycine in spinal cord slices, which in turn prolonged the duration of glycinergic synaptic current and potentiated the NMDA-mediated synaptic response.


Figures

Figure 1
Figure 1. Effect of ORG 24598, a glial GlyT blocker, on glycinergic mIPSCs
A, bath application of 10 μm ORG 24598, a glial glycine transporter blocker, induced an increase in membrane current noise accompanied by a slowly developing inward current. Bath application of strychnine (1 μm) blocked the inward current and mIPSCs. The dotted line indicates the baseline current before ORG 24598 was applied. B, cmulative probability histogram of mIPSC amplitudes. Both distributions were not significantly different (Kolmogorov-Smirnov test, P > 0.01) indicating that ORG 24598 (10 μm) did not modify the amplitudes of mIPSCs. C, superimposition of mIPSCs recorded before and during the application of 10 μm ORG 24598. Each trace represented the average of 40 events. The decay phase of each trace was fitted by a monoexponential function with a decay time constant of 7 ms (control) and 16.5 ms (ORG 24598). D, histogram of the frequency of mIPSCs against time. The period of integration was 2 min. Each bar represented the mean ±s.e.m. in 5 cells. ORG 24598 (10 μm) was bath applied during the time indicated by the horizontal bar and did not affect the frequency of mIPSCs. Cells were held at −60 mV with ECl fixed at 1.9 mV. The temperature was 35°C. Recordings were performed in the presence of 0.5 μm TTX, 10 μm bicuculline, 2 mm kynurenic acid and 10 μm CNQX.
Figure 2
Figure 2. Effect of ORG 25543, a neuronal GlyT blocker, on the glycinergic mIPSCs
A, bath application of 10 μm ORG 25543, a neuronal glycine transporter blocker, induced an increase in the membrane current noise accompanied by a slow developing inward current. Bath application of strychnine (1 μm) blocked the inward current, the increase in noise and mIPSCs. The interruption in the current trace lasted 10 min. Bottom traces represent currents recorded before (left traces), during the application of ORG 25543 (middle traces) and after the application of strychnine (right traces). Note the reduction in membrane noise current during strychnine as compared to membrane noise levels in control conditions and during the application of ORG 25543. B, cmulative probability histogram of mIPSC amplitudes. Both distributions were not significantly different (Kolmogorov-Smirnov test P > 0.01) indicating that ORG 25543 (10 μm) did not modify the amplitude of mIPSCs. C, superimposition of mIPSCs recorded before and during the application of 10 μm ORG 25543. Each trace represented the average of 200 events. ORG 25543 increased the time constant from a control value of 6.4 ms to 20 ms in the presence of the GlyT blocker. D, histogram of the frequency of mIPSCs against time. The period of integration was 2 min. Each bar represents the mean ±s.e.m. for 3 cells. ORG 25543 (10 μm) bath applied during the time indicated by the horizontal bar reduced the frequency of mIPSCs. A full suppression was observed 40 min after the beginning of application of ORG 25543. Holding potential was −60 mV and ECl was fixed at 1.9 mV. The temperature was 35°C. Recordings were performed in the presence of 0.5 μm TTX, 10 μm bicuculline, 2 mm kynurenic acid and 10 μm of CNQX.
Figure 3
Figure 3. Effects of ORG 25543 and ORG 24598 on miniature, spontaneous and evoked IPSCs
A, IPSCs evoked by focal electrical stimulation (100 μs, 20 V) were elicited every 5 s in control conditions (left traces) and in the presence of ORG compounds (right traces). Each trace represents the average of 40 events. ORG 24598 (10 μm) increased the decay time constant from a control value of 6 ms to 14.3 ms (upper traces). ORG 25543 (10 μm) increased the decay time constant from a control value of 7 ms to 17.3 ms (lower traces). B, bar graph summarizing the change in the amplitude (A), frequency (F) and decay time constant (τ) of eIPSCs, sIPSCs and mIPSCs induced by ORG 24598 and ORG 25543. The results are expressed as a percentage of control (100%, dotted line). Each bar represents the mean ±s.e.m. with n the number of cells tested given in parentheses for each type of recordings and each blocker. Stars indicate significance (Student's t test, P < 0.05). Same recording conditions as in Fig. 1 except that eIPSCs and sIPSCs were recorded in the absence of TTX.
Figure 4
Figure 4. Effects of ORG 25543 and ORG 24598 on evoked IPSCs
Focally IPSCs were evoked every 3 s by focal electrical stimulation (100 μs, 20 V). A, superfusion of the GlyT1 blocker ORG 24598 (indicated by the horizontal bar) did not significantly modify the amplitude of the mean eIPSCs. Each square corresponds to the mean amplitude of 60 consecutive eIPSCs. The traces are representative of control eIPSCs recorded before and after 50 min of application of ORG 24598 (filled squares). B, superfusion of the GlyT2 blocker ORG 25543 reduced progressively the amplitude of the mean eIPSCs. Each square corresponds to the mean amplitude of 30 consecutive eIPSCs. The traces are representative of control eIPSCs recorded before and after 50 min of application of ORG 25543 (filled squares). Cells were held at −60 mV with ECl fixed at 1.9 mV. The temperature was 35°C. Recordings were performed in the presence of 10 μm bicuculline, 2 mm kynurenic acid and 10 μm CNQX.
Figure 5
Figure 5. Effect of the temperature on the decay time of glycinergic eIPSCs
eIPSCs were evoked every 3 s and recorded at 20°C, 35°C and 35°C in the presence of ORG 25543 (10 μm). eIPSCs were averaged every 90 s (30 events) and the decay time constant was determined for each eIPSC mean. The decay time constant of each eIPSC mean was plotted against time in B. Increasing the temperature from 20°C to 35°C decreased the decay time of averaged eIPSCs from 9.9 ms to 5.2 ms. The traces illustrated in A correspond to the data indicated by the filled squares in B. The perfusion of ORG 25543 at 35°C progressively increased the decay time constant of eIPSCs. As shown by the lower trace in A, the decay time of a representative averaged eIPSCs in the presence of ORG 25543 was 15 ms. Cells were held at −60 mV with ECl fixed at 1.9 mV. Recordings were performed in the presence of 0.5 μm TTX, 10 μm bicuculline and 2 mm kynurenic acid.
Figure 6
Figure 6. Effects of the substitution of extracellular Na+ by N-methyl-d-glucamine (NMDG) on IPSC properties
A, example of mIPSCs recorded in control conditions (left trace) and 5 min after replacement of Na+ by NMDG (right trace). Each trace is the average of 63 events. The decay time constant increased from a control value of 5 ms to 11 ms. B, mIPSCs or sIPSCs were recorded (4 cells in each group). For each cell, the amplitude, decay time constant (τ) and frequency of miniature and spontaneous IPSCs were measured in control conditions and after the replacement of Na+ by NMDG. Values in NMDG were normalized with respect to values under control conditions and expressed as a percentage of the control. The dotted line indicates 100%. The bar graph illustrates the change of the basic properties of mIPSCs and sIPSCs. Each bar represents the mean ±s.e.m. for 4 cells. Stars indicate significance (Student's t test P < 0.05). Same recording conditions as that in Fig. 1 except that sIPSCs were recorded in the absence of TTX.
Figure 7
Figure 7. Bath application of glycine mimicked the effect of GlyT blockers on the decay time constant of IPSCs
A, mIPSCs were recorded in a cell during steady—state superfusion with different external concentration of glycine in the bath. Each trace corresponds to the mean of 60 events. Increasing external glycine concentration increased the decay time constant from a control value of 6 ms to 7.6, 8 and 13.1 ms. B, the decay time constants of mIPSCs, eIPSCs and sIPSCs were measured in control condition (no added glycine) and with 1, 3 and 5 μm glycine. Each bar represents the mean ±s.e.m. and the number of cells tested is given in parentheses for each type of recording. Raising glycine concentration increases progressively the decay time constant of mIPSCs, eIPSCs and sIPSCs. Stars indicate that the increase was statistically different from control value (P < 0.05) with 5 μm of added glycine in the bath solution. Same recording conditions as that in Fig. 1 except that eIPSCs and sIPSCs were recorded in the absence of TTX.
Figure 8
Figure 8. Effect of ORG 24598 on GABAergic mIPSCs
A, bath application of 10 μm ORG 24598 as indicated by the bar did not induce a detectable increase in membrane current noise or a change in the baseline holding current. The dotted line indicates the baseline current before ORG 24598 was applied. GABAergic mIPSCs appear as fast downward deflections of the current trace. They were blocked by the superfusion of 10 μm bicuculline. B, cmulative probability histogram of mIPSC amplitudes. Both distributions were not significantly different (Kolmogorov-Smirnov test P > 0.01) indicating that ORG 24598 (10 μm) did not modify the amplitude of mIPSCs. C, superimposition of mIPSCs recorded before and during the application of 10 μm ORG 24598. Each trace represents the average of 100 events. The decay time of each trace was fitted by a monoexponential function with a decay time constant of 19.0 ms (control) and 20.0 ms (ORG 24598). D, histogram of the frequency of mIPSCs against time. Each bar represents the averaged frequency intervals ±s.e.m. from the cell illustrated in A. The period of integration was 2 min. ORG 24598 (10 μm) bath applied during the time indicated by the horizontal bar did not affect the frequency of mIPSCs. Cells were held at −60 mV. The temperature was 35°C. Recordings were performed in the presence of 0.5 μm TTX, 1 μm strychnine, 2 mm kynurenic acid and 10 μm of CNQX.
Figure 9
Figure 9. Effect of ORG 25543 on GABAergic mIPSCs
A, bath application of 10 μm ORG 25543 did not induce a detectable increase in the membrane current noise or a change in the baseline holding current. GABAergic mIPSCs were suppressed by the application of 10 μm bicuculline. B, cmulative probability histogram of mIPSC amplitudes shows that both distributions are not significantly different (Kolmogorov-Smirnov test P > 0.01). C, superimposition of mIPSCs recorded before and during the application of 10 μm ORG 25543. Each trace represents the average of 30 events. The decay time of each trace was fitted by a monoexponential function with a decay time constant of 17.0 ms (control) and 18.3 ms (ORG 25543). D, histogram of the frequency of mIPSCs against time. Each bar represents the averaged frequency intervals ±s.e.m. from the cell illustrated in A. The period of integration was 3 min. ORG 25543 (10 μm) bath applied during the time indicated by the horizontal bar did not affect the frequency of mIPSCs. Cells were held at −60 mV with ECl fixed at 1.9 mV. The temperature was 35°C. Recordings were performed in the presence of 0.5 μm TTX, 1 μm strychnine, 2 mm kynurenic acid and 10 μm CNQX.
Figure 10
Figure 10. Potentiation of the NMDA component of the glutamatergic transmission by glycine and d-serine
A, EPSCs were evoked every 3 s by focal electrical stimulation (100 μs, −30 V) under control conditions (left trace), after addition of glycine (5 μm) in the perfusion (middle trace) and after the further addition of 30 μm DCKA (right trace). Each trace is the average of 10 consecutive eEPSCs. No failure was observed and EPSCs recorded under control conditions were of maximal amplitude. The histogram shows the time course of the effect of bath-applied glycine (5 μm) and DCKA (30 μm) on the peak amplitude of eEPSCs. Each open circle represents the mean of the peak amplitude of 10 consecutive eEPSCs. Glycine progressively increased the amplitude of eEPSCs whereas DCKA abolished eEPSCs. B, eEPSCs were evoked in 4 cells with increasing concentrations of glycine (1–3 μm) added to the bath superfusion medium. The amplitudes of eEPSCs were measured and normalized to the mean peak amplitude under control conditions (no glycine added to the bath solution). Bars represent the relative amplitude of eEPSCs as a function of the glycine concentration which was bath applied. Each bar is the mean ±s.e.m. (n = 4 cells). C, potentiation of NMDA eEPSCs by d-serine but not l-serine. Superfusion of 10 μmd-serine increased reversibly the amplitude of eEPSCs whereas l-serine had no effect. Each trace is the average of 40 events recorded before (left traces), during (middle traces) and after (right traces) the application of d-serine (upper traces) or l-serine (lower traces). Cells were held at −60 mV with ECl fixed at 1.9 mV. The temperature was 35°C. Recordings were performed in Mg2+-free aCSF containing 10 μm bicuculline, 1 μm strychnine and 10 μm CNQX.
Figure 11
Figure 11. Effect of ORG 24598 on NMDA and non-NMDA-mediated eEPSCs
A, eEPSCs were evoked every 3 s in the presence of CNQX (10 μm) and strychnine (1 μm). The lower graph illustrates the time course of the effect of ORG 24598 (10 μm) on the peak amplitude of eEPSCs. Each point represents the mean amplitude of 10 consecutive eEPSCs. APV (30 μm) abolished entirely the eEPSCs. Upper traces are representative of averaged eEPSCs in control condition (left trace), after 20 min in presence of ORG 24598 (middle trace) and in the presence of ORG 24598 and APV (right trace). B, effect of ORG 24598 on non-NMDA-mediated eEPSCs. eEPSCs were evoked every 3 s in presence of APV (30 μm) and strychnine (1 μm). The lower plot illustrates the time course of the effect of ORG 24598 10 μm on the peak amplitude of eEPSCs. Each point represents the mean amplitude of 10 consecutive eEPSCs. CNQX (10 μm) abolished the eEPSCs. Upper traces are representative of averaged non-NMDA-mediated eEPSCs in control condition (left trace), after 20 min in presence of ORG 24598 (middle trace) and in presence of ORG 24598 and CNQX (right trace). Cells were held at −60 mV with ECl fixed at 1.9 mV. The temperature was 35°C. Recordings were performed in Mg2+-free aCSF containing 10 μm bicuculline, 1 μm strychnine, and 10 μm CNQX (cell in A) or 30 μm APV (cell in B).
Figure 12
Figure 12. Effect of ORG 25543 on NMDA and non-NMDA-mediated eEPSCs
A, effect of ORG 25543 on NMDA-mediated eEPSCs. eEPSCs were evoked every 3 s in the presence of CNQX (10 μm) and strychnine (1 μm). The lower plot illustrates the time course of the effect of ORG 25543 (10 μm) on the peak amplitude of eEPSCs. Each point represents the mean amplitude of 10 consecutive eEPSCs. DCKA (30 μm) abolished entirely the eEPSCs. Upper traces are representative of averaged eEPSCs in control condition (left trace), after 10 min in the presence of ORG 25543 (middle trace) and in the presence of ORG 25543 and DCKA (right trace). B, effect of ORG 25543 on non-NMDA-mediated eEPSCs. eEPSCs were evoked every 3 s in the presence of APV (30 μm) and strychnine (1 μm). The lower plot illustrates the time course of the effect of ORG 25543 (10 μm) on the peak amplitude of eEPSCs. Each point represents the mean amplitude of 10 consecutive eEPSCs. CNQX (10 μm) abolished the eEPSCs. Upper traces are representative of averaged non-NMDA-mediated eEPSCs in control condition (left trace), after 20 min in the presence of ORG 25543 (middle trace) and in the presence of ORG 25543 and CNQX (right trace). Cells were held at −60 mV with ECl fixed at 1.9 mV. The temperature was 35°C. Recordings were performed in Mg2+-free aCSF containing 10 μm bicuculline, 1 μm strychnine, and 10 μm CNQX (cell in A) or 30 μm APV (cell in B).

References

    1. Adams RH, Sato K, Shimada S, Tohyama M, Puschel AW, Betz H. Gene structure and glial expression of the glycine transporter GlyT1 in embryonic and adult rodents. J Neurosci. 1995;15:2524–2532. - PMC - PubMed
    1. Ahmadi S, Muth-Selbach U, Lauterbach A, Lipfert P, Neuhuber WL, Zeilhofer HU. Facilitation of spinal NMDA receptor currents by spillover of synaptically released glycine. Science. 2003;300:2094–2097. - PubMed
    1. Bergeron R, Meyer TM, Coyle JT, Greene RW. Modulation of N-methyl-D-aspartate receptor function by glycine transport. Proc Natl Acad Sci U S A. 1998;95:15730–15734. - PMC - PubMed
    1. Bordey A, Feltz P, Trouslard J. Nicotinic actions on neurones of the central autonomic area in rat spinal cord slices. J Physiol. 1996;497:175–187. - PMC - PubMed
    1. Bradaïa A, Trouslard J. Fast synaptic transmission mediated by alpha-bungarotoxin-sensitive nicotinic acetylcholine receptors in lamina X neurones of neonatal rat spinal cord. J Physiol. 2002a;544:727–739. - PMC - PubMed

Publication types

MeSH terms

LinkOut - more resources