Comparative Study
. 2004 Aug 15;559(Pt 1):231-43.
doi: 10.1113/jphysiol.2004.067934. Epub 2004 Jul 2.

Purinergic regulation of guinea pig suburothelial myofibroblasts

Affiliations
Comparative Study

Purinergic regulation of guinea pig suburothelial myofibroblasts

C Wu et al. J Physiol. .

Abstract

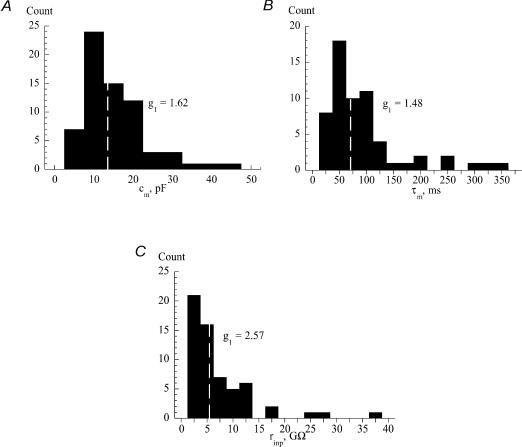
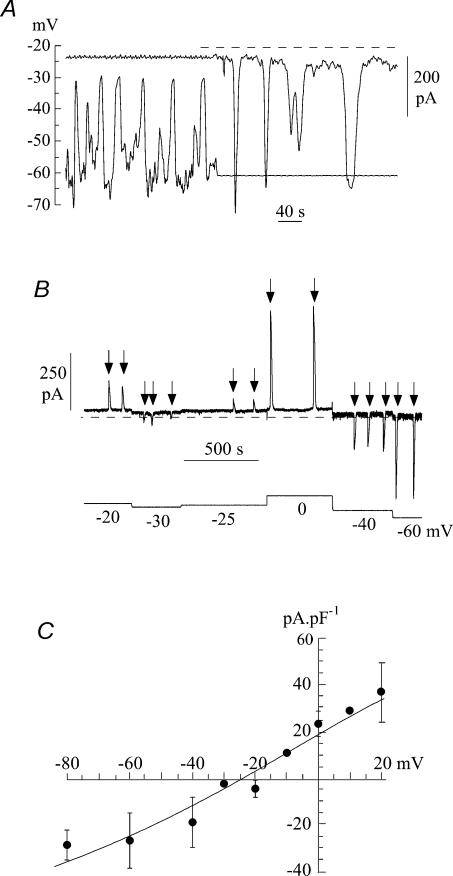
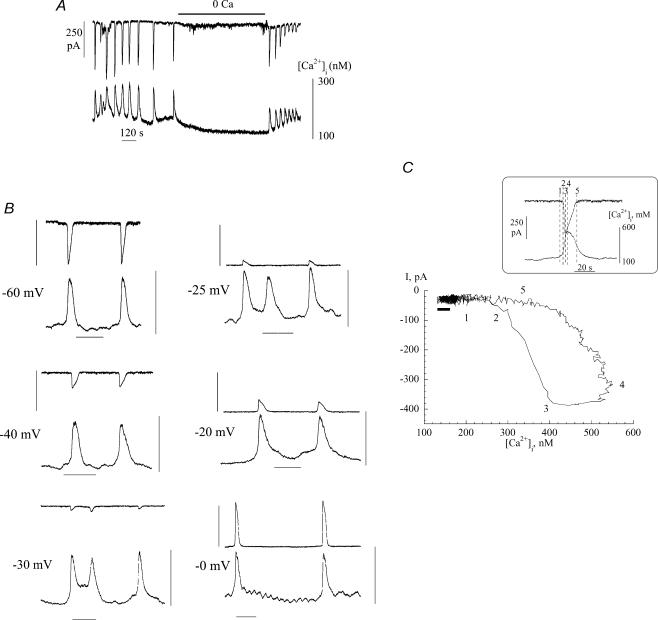
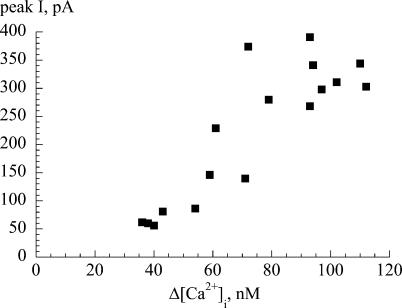
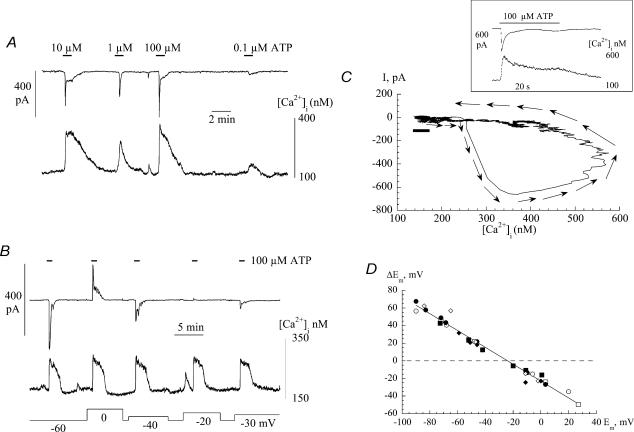
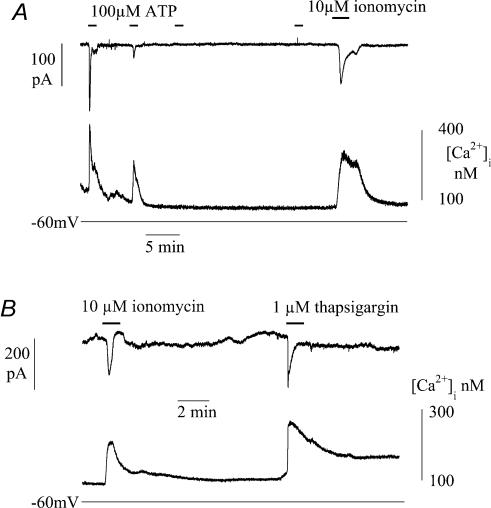
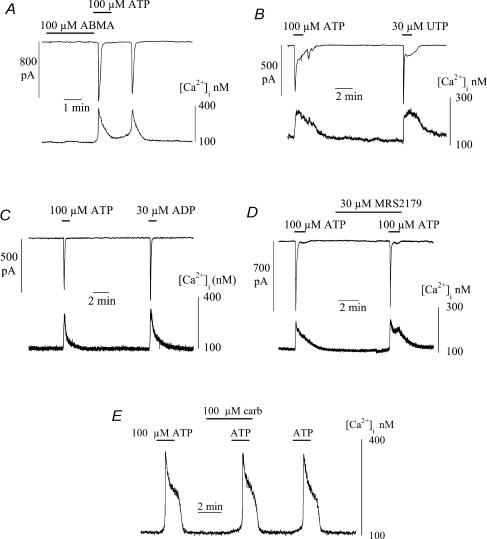
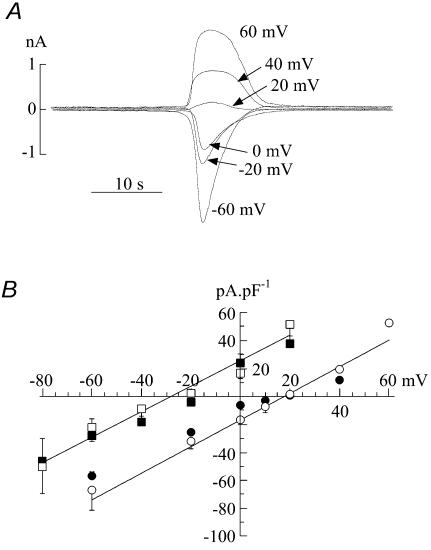
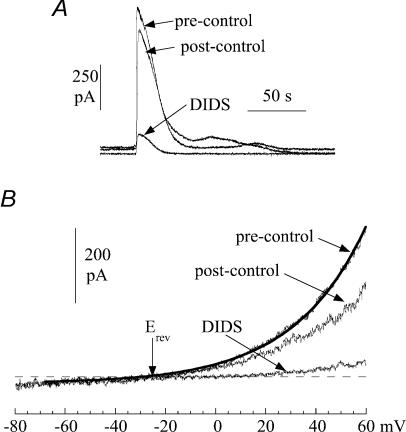
The Ca(2+)-regulating and electrophysiological properties of guinea-pig suburothelial myofibroblasts have been measured in order to investigate their potential role in the sensation of bladder fullness, due to their strategic position between the urothelium and afferent fibres. Previous work has shown that stretch of the bladder wall releases ATP. Cells that stain positively for vimentin were isolated. About 45% of cells (median membrane capacitance 13.3 pF) exhibited spontaneous depolarizations to about -25 mV with a physiological Cl(-) gradient (frequency 2.6 +/- 1.5 min(-1), duration 14.5 +/- 2.2 s, n= 15). Under voltage-clamp spontaneous inward currents (frequency 1.5 +/- 0.2 min(-1), duration 14.5 +/- 7.0 s, n= 18) were recorded, with a similar reversal potential. The spontaneous currents were preceded by intracellular Ca(2+) transients with a magnitude that was independent of membrane potential. All cells tested responded to ATP by generating an intracellular Ca(2+) transient, followed by inward currents; the currents had a similar reversal potential and slope conductance to their spontaneous counterparts. ATP-generated transients were mimicked by UTP and ADP but not by alpha,beta-methylene-ATP (1-10 microm) or CTP (30 microm), indicating that ATP acts via a P2Y receptor. Transients were partially attenuated by 1 mm suramin but PPADS (80 microm) had no effect. These data indicate that ATP acts via a P2Y receptor, but responses were resistant to the P2Y(1) antagonist MRS2179. ATP-generated transients were abolished by intracellular perfusion with heparin and TMB-8 indicating that IP(3) was the intracellular second messenger. The reversal potentials of the spontaneous and ATP-generated currents were shifted by about +45 mV by a 12-fold reduction of the extracellular [Cl(-)] and the currents were greatly attenuated by 1 mm DIDS. No transients were generated on exposure to the muscarinic agonist carbachol. We propose that these cells may play a regulatory step in the sensation of bladder fullness by responding to ATP. The precise mechanism whereby they couple urothelial ATP release to afferent excitation is the next step to be elucidated.


Figures

Figure 1
Figure 1. Histograms of electrical characteristics of guinea-pig suburothelial myofibroblasts
A, membrane capacitance, cm. B, membrane time constant, τm. C, input resistance, rinp. The white dotted line in each part shows the median value. The skewness values, g1, of each data set are shown in the relevant part.
Figure 2
Figure 2. Spontaneous currents in suburothelial myofibroblasts
A, current- and voltage-clamp recordings from an isolated cell using a Cs+-filled pipette. The first half of the record is under current-clamp; the second half shows ionic current recorded when voltage-clamped at −60 mV. Dotted line shows the zero-current level. B, voltage dependence of spontaneous currents under voltage-clamp: holding potential was varied between −60 and 0 mV in this example in a series of steps. Spontaneous currents are arrowed. C, current–voltage relationship of spontaneous currents from seven cells. Mean ±s.d. of data; the straight line was fitted by least-squares analysis of the mean data.
Figure 3
Figure 3. Spontaneous currents and Ca2+-transients in suburothelial myofibroblasts
A, simultaneous recording of inward currents and [Ca2+]i; holding potential −60 mV. B, voltage dependence of spontaneous currents and Ca2+-transients; the holding potential is denoted beside each pair of traces. Vertical bars: 400 pA for upper trace, 100–600 nm[Ca2+]i for lower trace; horizontal bar: 1 minute. C, phase-plane plot of the relationship between current and [Ca2+]i. The recordings used to generate the plot are shown in the box, the numbers refer to different times within the plots. The horizontal black bar below the left limb of the plot shows the inherent noise in the traces used to generate the plot. The thickness of the line represents the variance of current noise; the length is the variance of the [Ca2+] signal noise. Because the change of [Ca2+], before current is evoked, is greater than the length of this bar the observation that [Ca2+] changes before current is generated is a real phenomenon and not a random event due to variations of noise in the signals.
Figure 4
Figure 4. Relationship between the peak inward current and change of the intracellular [Ca2+]
The plot relates the magnitudes of the two phenomena during a series of spontaneous transients recorded from a suburothelial myofibroblast. Cell held under voltage-clamp at −60 mV with a K+-filled pipette.
Figure 5
Figure 5. ATP-induced Ca2+ transients and spontaneous currents in suburothelial myofibroblasts
A, the effect of ATP in concentrations ranging from 0.1 to 100 μm ATP was added during the periods indicated by the horizontal bars. Cell voltage-clamped at −60 mV with a Cs+-filled pipette. B, voltage dependence of Ca2+ transients and spontaneous currents induced by 100 μm ATP. Membrane potential was varied between −60 and 0 mV. C, phase-plane plot of the relationship between current and intracellular [Ca2+]. The recordings used to generate the plot are shown in the box; arrows indicate the direction of time. The horizontal black bar below the left limb of the plot shows the inherent noise in the traces used to generate the plot. D, the relationship between the change of membrane potential, ΔEm, and the initial value, Em, upon addition of 100 μm ATP. The straight line was calculated by least squares analysis Data are from six separate cells are shown as indicated by different symbols.
Figure 6
Figure 6. Intracellular pathways for Ca2+ release and uptake in suburothelial myofibroblasts
A, Ca2+ transients and inward currents during infusion of intracellular low molecular mass heparin by four successive exposures to 100 μm ATP (indicated by horizontal bars). After the last ATP exposure the cell was superfsed with 10 μm ionomycin and the effect of 10 μm ionomycin. B, the effects of 10 μm ionomycin and 1 μm thapsigargin. Cells voltage-clamped with Cs+-filled pipettes at −60 mV.
Figure 7
Figure 7. The actions of purinergic receptor agonists and antagonists and carbachol on intracellular [Ca2+] and membrane currents in suburothelial myofibroblasts
A, effects of α,β-methylene-ATP (ABMA) and ATP (100 μm). B, actions of 100 μm ATP and 30 μm UTP. C, actions of 100 μm ATP and 30 μm ADP. D, ATP Ca2+ transients in the presence of the P2Y1 receptor antagonist MRS2179 (30 μm). E, ATP-induced Ca2+-transients in the presence of carbachol (100 μm). All agents added where indicated by the horizontal bars; cells voltage-clamped at −60 mV with Cs+-filled pipettes.
Figure 8
Figure 8. Cl dependence of spontaneous and ATP-induced spontaneous currents
A, superimposed current transients from the same cell, elicited by 100 μm ATP at different holding potentials in low-extracellular Cl solution (10.6 mm). Current–voltage relationships of ATP-induced (filled symbols) and spontaneous (open symbols) currents in normal extracellular [Cl] (squares) and low extracellular [Cl] (circles). All experiments used Cs+-filed pipettes.
Figure 9
Figure 9. The action of DIDS (1.2 mm) on spontaneous currents in suburothelial myofibroblasts
A, three superimposed transients from a continuous recording. B, current–voltage relationship of membrane current during a quiescent phase. Membrane potential was changed as a ramp (0.16 V s−1). The line through the pre-control data was best-fitted using eqn (1) (Methods) and the reversal potential, Erev, indicated. Cells were voltage-clamped at 0 mV with a Cs+-filled pipette.

References

    1. Bogdanov YD, Wildman SS, Clements MP, King BF, Burnstock G. Molecular cloning and characterisation of rat P2Y4 nucleotide receptor. Br J Pharmacol. 1998;124:428–430. - PMC - PubMed
    1. Boyer JL, Mohanram A, Camaioni E, Jacobson KA, Harden TK. Competitive and selective antagonism of P2Y1 receptors by N6-methyl 2′-deoxyadenosine 3′,5′-bisphosphate. Br J Pharmacol. 1998;124:1–3. - PMC - PubMed
    1. Cockayne DA, Hamilton SG, Zhu Q-M, Dunn PM, Zhong Y, Novakovic S, Malmberg AB, Cain G, Berson A, Kassotakis L, Hedley L, Lachnit WG, Burnstock G, McMahon SB, Ford APD. Urinary bladder hyporeflexia and reduced pain-related behaviour in P2X3-deficient mice. Nature. 2000;407:1011–1015. - PubMed
    1. De Groat WC, Yoshimura N. Pharmacology of the lower urinary tract. Ann Rev Pharmacol Toxicol. 2001;41:691–721. - PubMed
    1. Donovan J, Naughton M, Gotoh M, Corcos J, Jackson S, Kelleher C, Lukacs B, Costa P. Symptom and quality of life assessment. In: Abrams P, Khoury S, Wein A, editors. Incontinence. Plymouth, UK: Health Publications Ltd; 1999. pp. 295–331.

Publication types

LinkOut - more resources