Comparative Study
. 2004 Aug 15;559(Pt 1):67-84.
doi: 10.1113/jphysiol.2004.066944. Epub 2004 Jul 2.

Muscarinic modulation of erg potassium current

Affiliations
Comparative Study

Muscarinic modulation of erg potassium current

Wiebke Hirdes et al. J Physiol. .

Abstract

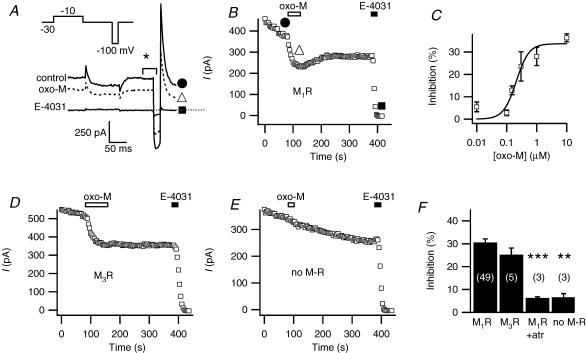
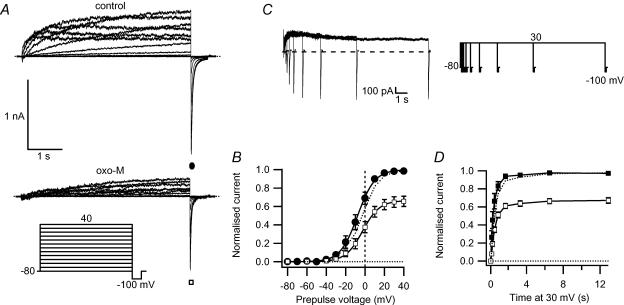
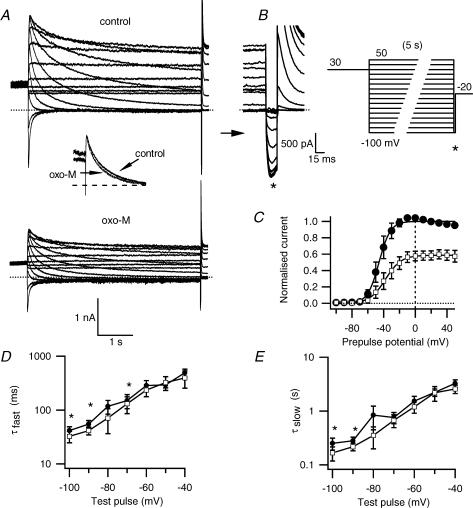
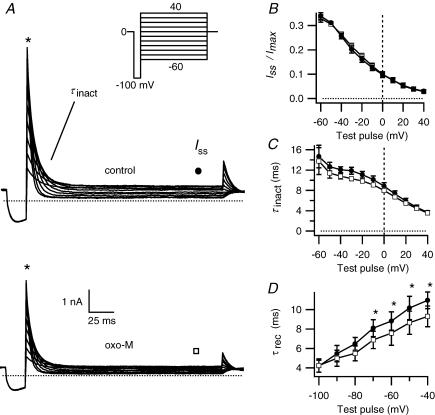
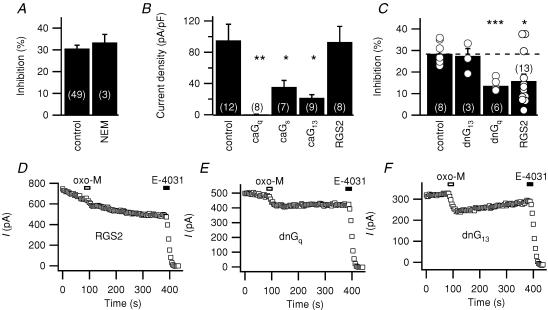
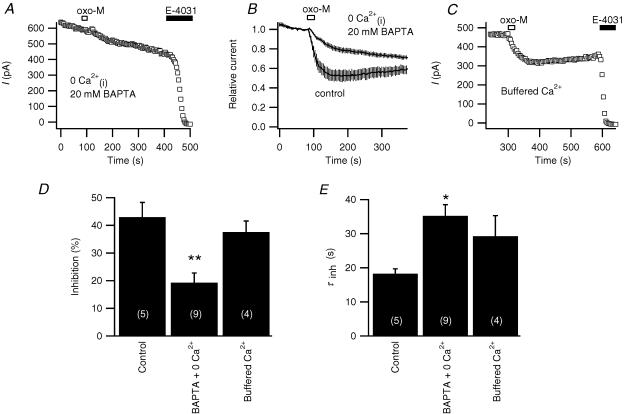
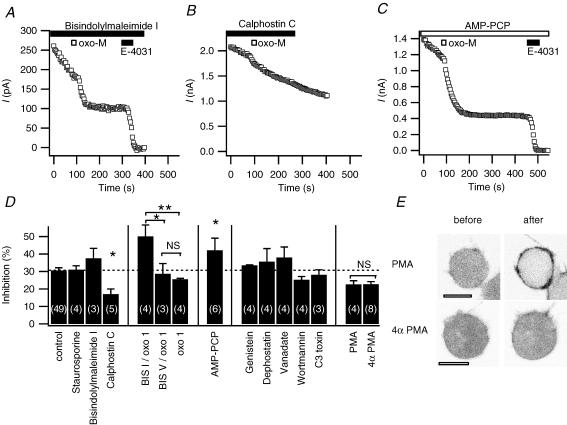
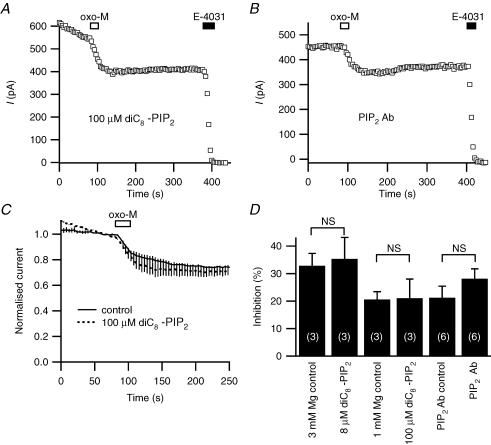
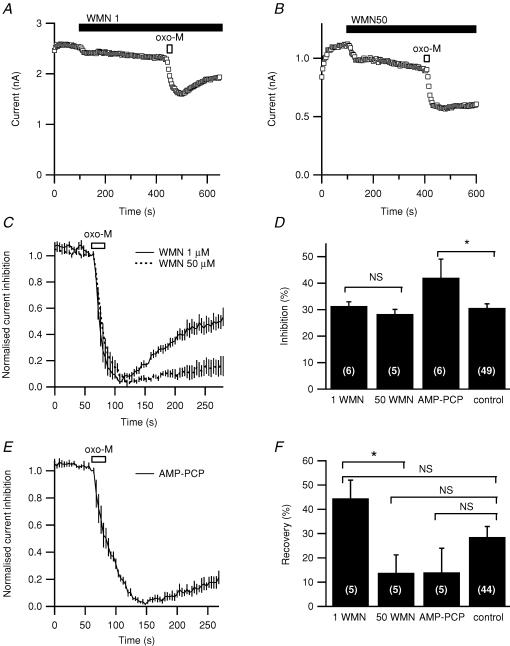
We studied modulation of current in human embryonic kidney tsA-201 cells coexpressing rat erg1 channels with M(1) muscarinic receptors. Maximal current was inhibited 30% during muscarinic receptor stimulation, with a small positive shift of the midpoint of activation. Inhibition was attenuated by coexpression of the regulator of G-protein signalling RGS2 or of a dominant-negative protein, G(q), but not by N-ethylmaleimide or C3 toxin. Overexpression of a constitutively active form of G(q) (but not of G(13) or of G(s)) abolished the erg current. Hence it is likely that G(q/11), and not G(i/o) or G(13), mediates muscarinic inhibition. Muscarinic suppression of erg was attenuated by chelating intracellular Ca(2+) to < 1 nm free Ca(2+) with 20 mm BAPTA in the pipette, but suppression was normal if internal Ca(2+) was strongly clamped to a 129 nm free Ca(2+) level with a BAPTA buffer and this was combined with numerous other measures to prevent intracellular Ca(2+) transients (pentosan polysulphate, preincubation with thapsigargin, and removal of extracellular Ca(2+)). Hence a minimum amount of Ca(2+) was necessary for the inhibition, but a Ca(2+) elevation was not. The ATP analogue AMP-PCP did not prevent inhibition. The protein kinase C (PKC) blockers staurosporine and bisindolylmaleimide I did not prevent inhibition, and the PKC-activating phorbol ester PMA did not mimic it. Neither the tyrosine kinase inhibitor genistein nor the tyrosine phosphatase inhibitor dephostatin prevented inhibition by oxotremorine-M. Hence protein kinases are not needed. Experiments with a high concentration of wortmannin were consistent with recovery being partially dependent on PIP(2) resynthesis. Wortmannin did not prevent muscarinic inhibition. Our studies of muscarinic inhibition of erg current suggest a role for phospholipase C, but not the classical downstream messengers, such as PKC or a calcium transient.


Figures

Figure 1
Figure 1. M1- and M3-muscarinic receptors inhibit erg current
A, representative current traces from a cell expressing the M1 muscarinic receptor (M1R) and erg. Test pulses were given every 4 s from a holding potential of −30 mV. The voltage protocol (inset) is preceded by a prepulse to +30 mV for 2 s. The three current traces correspond to the marked points in B: before oxo-M (•), during application of the agonist oxo-M (▪) and after application of the blocker E-4031 (Δ). B, mean outward current at –30 mV (in the period marked * in A) is plotted versus time. The graph starts 1 min before oxo-M application. Bars indicate application of oxo-M (10 μm) and E-4031 (10 μm). The initial few minutes after achieving whole cell have been omitted. C, dose–response relation for oxo-M suppression of erg (n = 3–4 for each concentration). A Hill equation fitted to all data points gave half-maximal inhibition at 230 nm and a Hill coefficient of 2.5 ± 1.2 (standard deviation of fit). D, muscarinic suppression of erg in a cell transfected with the M3 muscarinic receptor (M3R) using the same pulse protocol as in A. E, lack of action of oxo-M in a cell not transfected with a muscarinic receptor (squares). F, erg current inhibition after oxo-M application in cells transfected with M1R, M3R, M1R after 4 min exposure to 10 μm atropine (M1R + atr), or no muscarinic receptor (no M-R). **P = 0.005 and ***P = 0.0005 indicate statistical significance versus controls.
Figure 2
Figure 2. M1R stimulation reduces maximal erg current activation
A, erg currents elicited by the activation protocol (inset) before and during 10 μm oxo-M. B, maximal tail current amplitudes, taken at −100 mV after stepping to different voltages for 5 s, for control (•) and after treatment with oxo-M (□, n = 7). Values normalized to maximal current under control conditions are plotted against the prepulse potential. The dotted curve shows the current after oxo-M scaled to the control current amplitude. C, tail-current pulse protocol and representative current traces for the time dependence of activation. D, time course of activation, with normalized tail current shown at different times, for control (▪), after oxo-M (□), and after oxo-M scaled to control (dotted line).
Figure 3
Figure 3. Muscarinic inhibition produces only minor changes in deactivation
A, erg current traces before and after oxo-M application, using the deactivation protocol in B. Inset of A shows an overlay of the prepulse current decay at −70 mV before and after oxo-M (scaled to control). The maximal tail current amplitudes at −100 mV (* on sweep-magnified traces and protocol), are measured after a 5 s prepulse that allows deactivation at different prepulse potentials. C, tail current amplitudes for control (•) or oxo-M (□) conditions normalized to maximal current (n = 4) and plotted against prepulse potential. D and E, fast (τfast) and slow (τslow) time constants of deactivation and a time constant for recovery from inactivation (see Fig. 4) were calculated by a triple exponential fit of the current deactivation at the prepulse potential for control (•) or oxo-M (□) (n = 4, *P≤ 0.05). The holding potential was −20 mV to minimize deactivation between test pulses. To maximize current activation, a 2 s prepulse to +30 mV preceded each test sweep. All current traces are E-4031-sensitive currents.
Figure 4
Figure 4. Muscarinic stimulation has only a minor effect on inactivation
A, erg current traces before and after oxo-M application using the inactivation protocol shown in the inset. An additional prepulse to +30 mV for 2 s from the holding potential of 0 mV is not depicted. B, voltage dependence of steady-state inactivation as seen in the test pulse plotted as the ratio of steady-state current Iss at (•) for control or at (□) for oxo-M, divided by the peak current Imax at *, as depicted in A. C, time constant of inactivation (τinact), for control (•) and oxo-M (□). D, time constant of recovery from inactivation (τrec), taken from a fit of the deactivation protocol as described in Fig. 3, for control (•) and oxo-M (□) (n = 4, *P≤ 0.05). All currents are E-4031-sensitive.
Figure 5
Figure 5. G protein involvement in muscarinic suppression of erg
A, muscarinic suppression of current in control cells and cells preincubated with the Gi/o inhibitor N-ethylmaleimide (NEM; 50 μm) for 2 min. The test pulse protocol for this and subsequent experiments is as in Fig. 1. B, initial density of current in cells overexpressing constitutively active forms of Gq, Gs or G13 (caGq, caGs or caG13) or RGS2. *P≤ 0.05 and **P≤ 0.005 indicate significant difference from controls. C, percentage suppression in cells overexpressing dominant-negative G13 or Gq (dnG13, dnGq), or RGS2. Individual observations are shown as open circles. *P≤ 0.05 and ***P≤ 0.0005 indicate significant difference from controls. D, E and F, representative time courses of test currents during inhibition by oxo-M in cells cotransfected with the indicated genes. For RGS2, the example is representative of 10/13 cells.
Figure 6
Figure 6. Full muscarinic modulation of erg requires a minimum amount of Ca2+
A, representative response to oxo-M when the internal Ca2+ was clamped to very low levels by a high concentration of BAPTA (20 mm) in the pipette and no Ca2+ was included in the pipette solution. B, averaged time course of oxo-M action using the same protocol as in A(n = 9), compared with controls from the same experimental days (n = 5). C, representative experiment with ‘buffered Ca2+ comprising: internal Ca2+ clamped at 129 nm with 20 mm BAPTA + 10 mm Ca2++ 50 μg ml−1 pentosan polysulphate (PPS) in the pipette, no Ca2+ in the bath, and 2 μm thapsigargin preincubation for > 20 min. D and E, amplitudes and time constants (τinh) of exponential fits of oxo-M inhibition in control cells, in cells with internal free Ca2+ buffered to less than 1 nm with 20 mm BAPTA and no Ca2+ added to the pipette solution (BAPTA + 0 Ca2+), and or in cells with ‘buffered Ca2+’ (*P≤ 0.05, **P≤ 0.01, versus controls from the same day, ANOVA).
Figure 7
Figure 7. Kinases are not involved in erg current inhibition by oxo-M
A, B and C, erg current inhibition by oxo-M after pretreatment with bisindolylmaleimide I (1 μm in the bath, following preincubation for 20–50 min), calphostin C (1 μm in the bath), and AMP-PCP (4 mm in the pipette, no ATP). Application in the bath is indicated by filled bars and application in the pipette solution by open bars. D, amplitude of muscarinic inhibition under control conditions and after applying one of the following: staurosporine, bisindolylmaleimide I, bisindolylmaleimide V, or calphostin C (1 μm); AMP-PCP replacing all ATP in the pipette (4 mm AMP-PCP); genistein (50 μm); dephostatin (50 μm); orthovanadate (0.5 mm); wortmannin (30 μm); or C3 toxin (3 μg ml−1 in the pipette solution with 1 mm NADPH); phorbol 12-myristate 13-acetate (PMA; 500 nm); or 4αPMA (500 nm). In one group of experiments, 1 μm oxo-M was used as indicated (oxo 1) instead of 10 μm oxo-M, and compared to same-day controls. Application of oxo-M was > 5 min after achieving whole-cell configuration to allow for diffusion of substances from the pipette. Inhibitors were applied in the bath for > 5 min prior to oxo-M, except for PMA (2 min) and bisindolylmaleimide I and V (additional > 20 min preincubation). NS, not significant, *P≤ 0.05, **P≤ 0.01. E, representative confocal images of cells transfected with the PKC-C1-EGFP probe and M1R, 3 min after a 2 min treatment with either PMA (n = 5) or 4αPMA (n = 4). Images are in negative contrast so that fluorescence is black. Scale bars are 10 μm.
Figure 8
Figure 8. Tests with application and removal of PIP2
A, representative response to oxo-M when the pipette included 100 μm dioctanoyl-PIP2 (diC8-PIP2, tip filled with normal solution to facilitate seal formation, > 10 min wait to allow diffusion). B, representative response to oxo-M when the pipette included PIP2 antibody for 20 min. C, averaged time courses of muscarinic inhibition with 100 μm diC8-PIP2 and controls (with 1 mm instead of 5 mm Mg2+). D, summary of whole-cell experiments with diC8-PIP2 and with PIP2 antibody (Ab).
Figure 9
Figure 9. Effects of wortmannin and removal of ATP
A and B, representative responses to oxo-M after preincubating with 1 μm or 50 μm wortmannin (WMN1 and WMN50). C, averaged time courses of muscarinic suppression and recovery after preincubation with 1 μm or 50 μm wortmannin (n = 5 for each). These data have been corrected for rundown and normalized (see Methods). D, summary of extent of inhibition with wortmannin or with 4 mm of the non-hydrolysable AMP-PCP replacing all pipette ATP. E, averaged time course of muscarinic suppression and recovery from inhibition with 4 mm AMP-PCP included in the pipette instead of ATP, corrected and normalized as in C. F, recovery from muscarinic inhibition measured with correction for rundown 3 min after maximal oxo-M inhibition with wortmannin or ATP-free pipette solution. *P≤ 0.05.

Similar articles

Cited by

References

    1. Barros F, Gómez-Varela D, Viloria CG, Palomero T, Giráldez T, de la Peña P. Modulation of human erg K+ channel gating by activation of a G protein-coupled receptor and protein kinase C. J Physiol. 1998;511:333–346. - PMC - PubMed
    1. Barros F, Mieskes G, del Camino D, de la Peña P. Protein phosphatase 2A reverses inhibition of inward rectifying K+ currents by thyrotropin-releasing hormone in GH3 pituitary cells. FEBS Lett. 1993;336:433–439. - PubMed
    1. Bauer CK, Meyerhof W, Schwarz JR. An inward rectifying K+ current in clonal rat pituitary cells and its modulation by thyrotrophin-releasing hormone. J Physiol. 1990;429:169–189. - PMC - PubMed
    1. Bauer CK, Schäfer R, Schiemann D, Reid G, Hanganu I, Schwarz JR. A functional role of the erg-like inward rectifying K+ current in prolactin secretion from rat lactotrophs. Mol Cell Endocrinol. 1999;148:37–45. - PubMed
    1. Bauer CK, Schwarz JR. Physiology of EAG K+ channels. J Membr Biol. 2001;182:1–15. - PubMed

Publication types

MeSH terms