Comparative Study
. 2004 Aug 15;559(Pt 1):215-30.
doi: 10.1113/jphysiol.2004.065672. Epub 2004 Jul 2.

Electrical and chemical transmission between striatal GABAergic output neurones in rat brain slices

Affiliations
Comparative Study

Electrical and chemical transmission between striatal GABAergic output neurones in rat brain slices

Laurent Venance et al. J Physiol. .

Abstract

Basal ganglia are interconnected subcortical nuclei, connected to the thalamus and all cortical areas involved in sensory motor control, limbic functions and cognition. The striatal output neurones (SONs), the major striatal population, are believed to act as detectors and integrators of distributed patterns of cerebral cortex inputs. Despite the key role of SONs in cortico-striatal information processing, little is known about their local interactions. Here, we report the existence and characterization of electrical and GABAergic transmission between SONs in rat brain slices. Tracer coupling (biocytin) incidence was high during the first two postnatal weeks and then decreased (postnatal days (P) 5-25, 60%; P25-30, 29%; n= 61). Electrical coupling was observed between 27% of SON pairs (coupling coefficient: 3.1 +/- 0.3%, n= 89 at P15) and as shown by single-cell RT-PCR, several connexin (Cx) mRNAs were found to be expressed (Cx31.1, Cx32, Cx36 and Cx47). GABAergic synaptic transmission (abolished by bicuculline, a GABA(A) receptor antagonist) observed in 19% of SON pairs (n= 62) was reliable (mean failure rate of 6 +/- 3%), precise (variation coefficient of latency, 0.06), strong (IPSC amplitudes of 38 +/- 12 pA) and unidirectional. Interestingly, electrical and chemical transmission were mutually exclusive. These results suggest that preferential networks of electrically and chemically connected SONs, might be involved in the channelling of cortico-basal ganglia information processing.


Figures
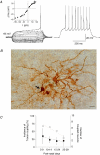
Figure 1
Figure 1. Electrophysiological characteristics of SONs and tracer coupling between SONs
A, characteristics of the membrane properties and spiking pattern of a SON: note the marked inward rectification (see also the steady-state IV relationship, means are from 145 SONs) and the long depolarizing ramp to spike threshold (delay to first spike is 450 ms in this example). Raw traces show individual voltage responses to series of 500 ms current pulses from −100 pA with 10 pA increasing current steps (left side) and to +50 pA above AP threshold (right side). B, example of a tracer coupling of a SON with other striatal neurones. Microphotograph of an electrophysiologically identified SON filled with biocytin (arrow) showing a tracer coupling of this neurone with four other SONs visible in this focal plan (note the dendritic spines present on a coupled neurone characteristic of SONs). Calibration bar: 10 μm. C, relations between the postnatal days and incidence of tracer coupling (○), and the number of coupled neurones (•). Correlation coefficients indicate that there is a significant decrease in the incidence of tracer coupling (r = −97, P < 0.05) without significant changes in the number of coupled neurones (r = −0.52, P = 0.18) with development.
Figure 2
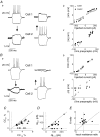
Figure 2. Symmetrical and asymmetrical voltage-independent electrotonic coupling between SON pairs
Simultaneous patch-clamp recordings from two pairs of electrically coupled SONs. Aa and Ba, current steps applied to cell 1 and then cell 2 as indicated by the arrows (−250 pA and +140 pA, 300 ms current steps) evoked voltage responses in the receiving cell (average traces from 15 to 40 sweeps). Aa, symmetrical electrical coupling recorded in a SON pair (CC1–2 = 2.8% and CC2−1 = 3.9%). Ba, asymmetrical electrical coupling between SONs. Membrane potential changes were occurring preferentially in the direction cell 1 to cell 2 and were much weaker in the direction cell 2 to cell 1 (CC1–2 = 2.5% and CC2−1 = 1.3%). Ab and Bb, plots of the relationship between injected currents and steady-state potential responses (ΔVm) of each presynaptic neurone. Ac and Bc, plots of the relationship between the presynaptic potential changes (ΔVm) and voltage postsynaptic responses (i.e. the transjunctional potential: ΔVj). The holding membrane potentials of SONs illustrated here were both held at −80 mV. C and D, comparison of CC and Gj in both directions indicates the existence of rectification for 32% of the SON pairs. The diagonal lines with a slope of 1 represents symmetrical coupling, and the horizontal and vertical dashed lines represent complete asymmetrical coupling, which was the case for 5 pairs of SONs. E, relation between apparent rectification (K ratio) and Rinput ratio. K ratio, the CC ratio for each SON pair, is the ratio of the higher to the lower CC (K ratio = CC1–2/CC2−1 with CC1–2 > CC2−1). The corresponding Rinput ratio is the ratio between the potential in the postsynaptic neurone versus the presynaptic potential in the direction of the larger CC. Horizontal and vertical dashed lines represent similar symmetrical CCs and similar Rinput values, respectively. The continuous diagonal represents values expected for cell pairs connected by a symmetrical Gj (with asymmetrical CCs and Rinput values). The mean K ratio value was 1.24 ± 0.07 (calculated without SON pairs showing a total asymmetry).
Figure 3
Figure 3. Electrical coupling between SON pairs displays transmission characteristics of a low-pass filter
A, subthreshold sinusoidal currents were injected into one cell of a coupled pair, and membrane deflections were recorded from the injected presynaptic cell (thin traces) and the postsynaptic coupled cell (thick traces). Two examples are shown for stimuli frequencies of 2 and 5 Hz (averages of 40 traces). B, frequency dependence of response attenuation. CC at each frequency was normalized to the CC for 1 Hz, for both directions for symmetrical pairs and the highest CC value for asymmetrical pairs. Attenuation was estimated as the CC normalized to the 1 Hz attenuation and expressed as a percentage (data from 5 SON pairs).
Figure 4
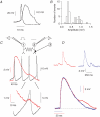
Figure 4. Attenuated transmission of presynaptic spikes (spikelets) and their impact on chemical transmission
A, averaged presynaptic spike and the induced averaged spikelet recorded in the postsynaptic cell of SON pairs. B, peak amplitude distribution of the postsynaptic spikelets (n = 52). The postsynaptic electrotonic responses segregate into two populations: one centred on 0.73 ± 0.25 mV (spikelets) and the other one centred on 0.30 ± 0.05 mV. C, spikelets are able to modify the decay of PSP resulting from chemical transmission. The presynaptic cell (cell 1) and the postsynaptic cell (cell 2) were electrically coupled (CC1–2 = 3.9 ± 0.7% and CC2−1 = 2.3 ± 0.2%), and cell 2 received strong chemical inputs (red trace) from a third cell (noted cell 3 in the scheme). Here, GABAergic transmission was being blocked (bicuculline), the PSP recorded in the postsynaptic cell (cell 2) was probably a glutamatergic EPSP. As shown in the enlarged section of the trace, the spikelet affected the time decay of the EPSP. D, comparison and superposition of two EPSPs of similar amplitudes: one with its decay modified by a spikelet after triggering a presynaptic AP train (red trace, 8.8 mV) and one recorded without presynaptic stimulation (blue trace, 10.6 mV). The upper traces display the two recordings over 1 s. Spikelets are able to effectively modulate the decay of excitatory postsynaptic events and to create conditions in which summations of cortical EPSPs are optimized.
Figure 5
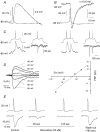
Figure 5. Evoked IPSCs and IPSPs recorded from SON pairs are mediated by GABAA receptors
A and B, presynaptic APs (top traces) and postsynaptic unitary PSPs and PSCs (bottom traces) recorded from two SONs. C, PSPs and PSCs evoked by one and two presynaptic APs. The chemical transmission at this SON–SON synapse was very reliable since no failure was observed along recording. D, averaged PSCs (n = 11–15) as a function of the membrane potential with low chloride (10 mm KCl) intracellular solution. In this condition, theoretical ECl = −65.3 mV, and experimentally the PSC reversed at −66 mV (n = 4). E, raw traces illustrating the reversible inhibition of the IPSC when bicuculline (20 μm, n = 4) is applied. The resting membrane potential of the pre- and postsynaptic SONs was −85 mV.
Figure 6
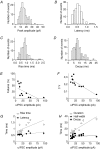
Figure 6. Amplitude and time course of the unitary postsynaptic conductance change at the SON–SON synapse
Data from a single SON pair (AD) and from 12 pairs (EH). A, peak amplitude distribution (15.1 ± 0.5 pA) of the somatic IPSCs evoked by single presynaptic APs. B, latency (0.56 ± 0.02 ms); C, 10–90% rise time (0.80 ± 0.03 ms); D, decay time constant (8.43 ± 0.31 ms, obtained by mono-exponential fit), of 137 uIPSCs. Holding potential was −85 mV and intracellular [Cl] was 30 mm. EH, summary graphs from the chemically coupled SON pairs (n = 12). E, reliability of synaptic transmission, indicated by a negative significant correlation (r = −59, P < 0.05) observed when percentage of failures was plotted as a function of the mean peak amplitude of the unitary IPSCs. F, variation coefficients (CVs) were inversely related to mean values of peak IPSC amplitudes (r = −81, P < 0.001). The mean CV of IPSC amplitudes was 0.22 ± 0.02 among the 12 SON–SON pairs. G and H, latency, rise time, decay, half-width and duration were plotted as a function of IPSC peak amplitudes. Significant correlations were observed for the rise time (r = 0.66, P < 0.05) and duration (r = 0.91, P < 0.001), but not (P > 0.05) for the half-width (r = 0.49), latency (r = 0.55) or decay (r = 0.07).
Figure 7
Figure 7. Short-term plasticity of IPSPs and IPSCs at SON–SON synapse
A and B, ratios of IPSP/Cs evoked by the first spike relative to those evoked by the second spike (absolute, A2, or relative values, ΔA2) were plotted as a function of the interspike interval (ISI). A marked depression was observed in the frequency range investigated. Significant linear correlations between IPSP (ΔA2/A1: r = 0.76, and A2/A1: r = −0.65, both P < 0.0001) are not, or weakly, observed between IPSC (ΔA2/A1: r = 0.25, P < 0.05 and A2/A1: r = 0.10, P > 0.1). The differences in the decay kinetics between IPSPs and IPSCs are responsible for such discrepancies (see Table 3), and allow a paired-pulse facilitation (PPF) of IPSP for ISI of < 30 ms but not for IPSC. C and D, IPSP2 and IPSC2 averaged relative values of amplitude, latency, rise time, half-width, duration and decay time constant for 50, 100 and 150 ms ISIs (n = 4 SON pairs). Absolute amplitudes (A2) were considered in this analysis. There is a significant increase of the rise time and a decrease in the duration of IPSPs and IPSCs and a significant decrease in the half-width of IPSCs. Data for A and B are from one SON pair and data of C and D are from four SON pairs. All of the SON pairs analysed here were from sagittal slices.
Figure 8
Figure 8. Electrical and unidirectional chemical transmissions are mutually exclusive between SONs
A, example of the unidirectionality of the GABAergic transmission between two SONs without detection of an electrical coupling. From cell 1 to cell 2, a presynaptic train of APs evoked IPSPs or IPSCs on the postsynaptic cell (note that there were no failure). In contrast, from cell 2 to cell 1 no postsynaptic events could be detected in voltage- or current-clamp mode (top and bottom traces, respectively). Hyperpolarizing steps failed to trigger an electrotonic response in the postsynaptic cells in both directions. Traces illustrating chemical transmission are from raw traces and those for electrical coupling come from averaging 30–45 traces. Holding membrane potentials of both cells were −80 mV. B, summary of the incidences of GABAergic and electrical transmissions. Unidirectional and bidirectional transmissions are indicated (see arrows). For electrical coupling, the term ‘unidirectional’ stands for strictly asymmetrical electrotonic coupling. C, schematic representation of the predicted effects of the unidirectional GABAergic lateral inhibition and the electrical coupling (bidirectional) between SONs on the output signal from the SONs (see size of the arrows for a facilitation or a decrease). It should be noted that GABAergic conductances are expected to be higher than the gap junction conductance values. Here, SONs were considered to receive synchronous cortical inputs of similar weight that trigger a train of APs. Four situations are illustrated: Ca and Cb, experimentally observed cases with mutually exclusive electrical coupling and unidirectional GABAergic transmission. Cc and Cd, putative situations mixing electrical and chemical coupling in agreement with experimental data. A more complex picture would be obtained if synchronous and asynchronous strong and weak cortical inputs are considered. The green and red arrows stand for the glutamatergic cortical inputs and for the GABAergic SON outputs, respectively.

Similar articles

Cited by

References

    1. Alexander GE, Crutcher MD. Functional architecture of basal ganglia circuits: neural substrates of parallel processing. Trends Neurosci. 1990;7:266–271. - PubMed
    1. Alexander GE, DeLong MR, Strick PL. Parallel organization of functionally segregated circuits linking basal ganglia. Annu Rev Neurosci. 1986;9:357–381. - PubMed
    1. Bartos M, Vida I, Frotscher M, Geiger JRP, Jonas P. Rapid signaling at inhibitory synapses in a dentate gyrus interneuron network. J Neurosci. 2001;21:2687–2698. - PMC - PubMed
    1. Bennett MVL. Electrical transmission: a functional analysis and comparison to chemical transmission. In: Kandel ER, editor. Handbook of Physiology, section 1, The Nervous System. Vol. 1. Baltimore: Williams & Wilkins; 1977. pp. 357–416.
    1. Bennett MVL, Zukin S. Electrical coupling and neuronal synchronization in the mammalian brain. Neuron. 2004;41:495–511. - PubMed

Publication types

Substances

LinkOut - more resources