

Inhibition of fatty acid synthase (FAS) suppresses HER2/neu (erbB-2) oncogene overexpression in cancer cells
- PMID: 15235125
- PMCID: PMC490000
- DOI: 10.1073/pnas.0403390101
Inhibition of fatty acid synthase (FAS) suppresses HER2/neu (erbB-2) oncogene overexpression in cancer cells
Abstract
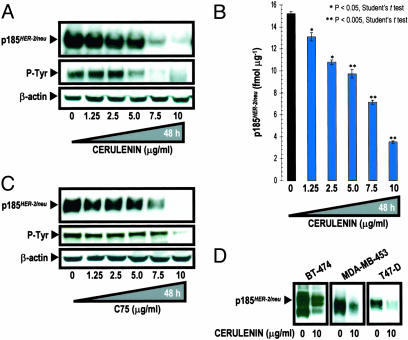
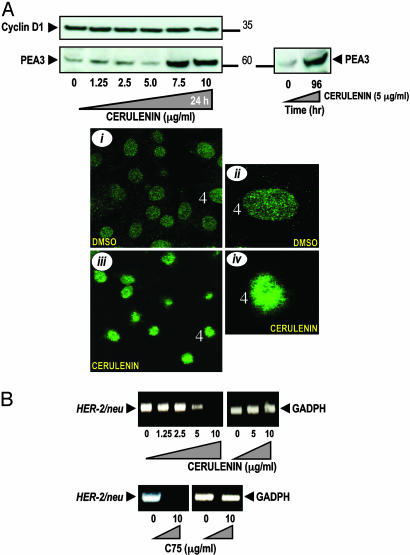
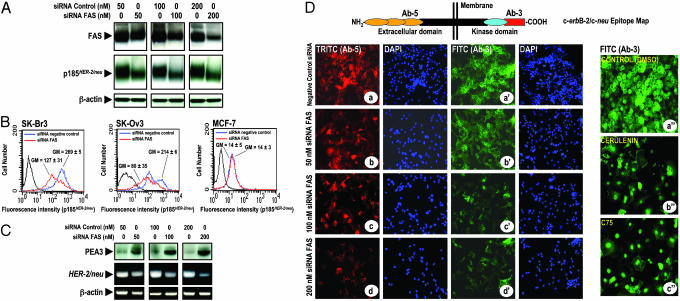
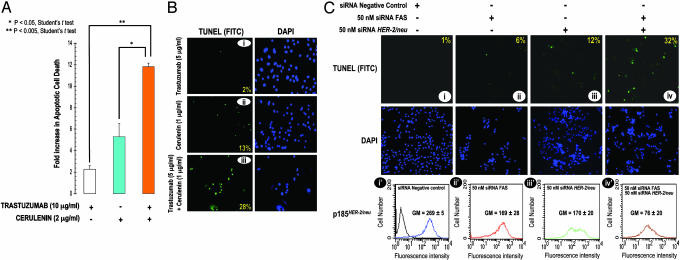
Fatty acid synthase (FAS) activity is a potential therapeutic target to treat cancer and obesity. Here, we have identified a molecular link between FAS and HER2 (erbB-2) oncogene, a marker for poor prognosis that is overexpressed in 30% of breast and ovarian cancers. Pharmacological FAS inhibitors cerulenin and C75 were found to suppress p185(HER2) oncoprotein expression and tyrosine-kinase activity in breast and ovarian HER2 overexpressors. Similarly, p185(HER2) expression was dramatically down-regulated when FAS gene expression was silenced by using the highly sequence-specific mechanism of RNA interference (RNAi). Pharmacological and RNAi-mediated silencing of FAS specifically down-regulated HER2 mRNA and, concomitantly, caused a prominent up-regulation of PEA3, a transcriptional repressor of HER2. A cytoplasmic redistribution of p185(HER2) was associated with marked morphological changes of FAS RNAi-transfected cells, whereas chemical inhibitors of FAS promoted a striking nuclear accumulation of p185(HER2). The simultaneous targeting of FAS and HER2 by chemical FAS inhibitors and the humanized antibody directed against p185(HER2) trastuzumab, respectively, was synergistically cytotoxic toward HER2 overexpressors. Similarly, concurrent RNAi-mediated silencing of FAS and HER2 genes synergistically stimulated apoptotic cell death in HER2 overexpressors. p185(HER2) was synergistically down-regulated after simultaneous inhibition of FAS and HER2 by either pharmacological inhibitors or small interfering RNA. These findings provide evidence of an active role of FAS in cancer evolution by specifically regulating oncogenic proteins closely related to malignant transformation, strongly suggesting that HER2 oncogene may act as the key molecular sensor of energy imbalance after the perturbation of tumor-associated FAS hyperactivity in cancer cells.
Figures
Similar articles
-
Antitumoral actions of the anti-obesity drug orlistat (XenicalTM) in breast cancer cells: blockade of cell cycle progression, promotion of apoptotic cell death and PEA3-mediated transcriptional repression of Her2/neu (erbB-2) oncogene.Ann Oncol. 2005 Aug;16(8):1253-67. doi: 10.1093/annonc/mdi239. Epub 2005 May 3. Ann Oncol. 2005. PMID: 15870086
-
Pharmacological blockade of fatty acid synthase (FASN) reverses acquired autoresistance to trastuzumab (Herceptin by transcriptionally inhibiting 'HER2 super-expression' occurring in high-dose trastuzumab-conditioned SKBR3/Tzb100 breast cancer cells.Int J Oncol. 2007 Oct;31(4):769-76. Int J Oncol. 2007. PMID: 17786307
-
Targeting fatty acid synthase: potential for therapeutic intervention in her-2/neu-overexpressing breast cancer.Drug News Perspect. 2005 Jul-Aug;18(6):375-85. doi: 10.1358/dnp.2005.18.6.927929. Drug News Perspect. 2005. PMID: 16247515 Review.
-
Pharmacological inhibition of fatty acid synthase (FAS): a novel therapeutic approach for breast cancer chemoprevention through its ability to suppress Her-2/neu (erbB-2) oncogene-induced malignant transformation.Mol Carcinog. 2004 Nov;41(3):164-78. doi: 10.1002/mc.20054. Mol Carcinog. 2004. PMID: 15390078
-
Targeting HER2: recent developments and future directions for breast cancer patients.Semin Oncol. 2001 Dec;28(6 Suppl 18):21-9. doi: 10.1053/sonc.2001.29724. Semin Oncol. 2001. PMID: 11774202 Review.
Cited by
-
Genome-wide changes accompanying knockdown of fatty acid synthase in breast cancer.BMC Genomics. 2007 Jun 12;8:168. doi: 10.1186/1471-2164-8-168. BMC Genomics. 2007. PMID: 17565694 Free PMC article.
-
Liver X Receptor Ligand GAC0001E5 Downregulates Antioxidant Capacity and ERBB2/HER2 Expression in HER2-Positive Breast Cancer Cells.Cancers (Basel). 2024 Apr 25;16(9):1651. doi: 10.3390/cancers16091651. Cancers (Basel). 2024. PMID: 38730603 Free PMC article.
-
Imaging the metabolic reprograming of fatty acid synthesis pathway enables new diagnostic and therapeutic opportunity for breast cancer.Cancer Cell Int. 2023 Apr 29;23(1):83. doi: 10.1186/s12935-023-02908-8. Cancer Cell Int. 2023. PMID: 37120513 Free PMC article.
-
Inter-organelle cross-talk supports acetyl-coenzyme A homeostasis and lipogenesis under metabolic stress.Sci Adv. 2023 May 3;9(18):eadf0138. doi: 10.1126/sciadv.adf0138. Epub 2023 May 3. Sci Adv. 2023. PMID: 37134162 Free PMC article.
-
Deubiquitinating enzymes as novel anticancer targets.Future Oncol. 2007 Apr;3(2):191-9. doi: 10.2217/14796694.3.2.191. Future Oncol. 2007. PMID: 17381419 Free PMC article. Review.
References
-
- Weiss, L., Hoffmann, G. E., Schreiber, R., Andres, E., Fuchs, E., Korber, E. & Kolb, H. J. (1986) Biol. Chem. Hoppe Seyler 367, 905-912. - PubMed
-
- Sul, H. S. & Wang, D. (1998) Annu. Rev. Nutr. 18, 331-351. - PubMed
-
- Kuhajda, F. P. Piantadosi, S. & Pasternack, G. R. (1989) N. Engl. J. Med. 321, 636-641. - PubMed
-
- Jensen, V., Holm-Nielsen, P. & Melsen, F. (1993) Breast Cancer Res. Treatment 27, 1-2.
MeSH terms
Substances
LinkOut - more resources
Full Text Sources
Other Literature Sources
Medical
Research Materials
Miscellaneous
