Comparative Study
. 2004 Jul 6;5(1):43.
doi: 10.1186/1471-2164-5-43.

Synaptotagmin gene content of the sequenced genomes

Affiliations
Comparative Study

Synaptotagmin gene content of the sequenced genomes

Molly Craxton. BMC Genomics. .

Abstract

Background: Synaptotagmins exist as a large gene family in mammals. There is much interest in the function of certain family members which act crucially in the regulated synaptic vesicle exocytosis required for efficient neurotransmission. Knowledge of the functions of other family members is relatively poor and the presence of Synaptotagmin genes in plants indicates a role for the family as a whole which is wider than neurotransmission. Identification of the Synaptotagmin genes within completely sequenced genomes can provide the entire Synaptotagmin gene complement of each sequenced organism. Defining the detailed structures of all the Synaptotagmin genes and their encoded products can provide a useful resource for functional studies and a deeper understanding of the evolution of the gene family. The current rapid increase in the number of sequenced genomes from different branches of the tree of life, together with the public deposition of evolutionarily diverse transcript sequences make such studies worthwhile.

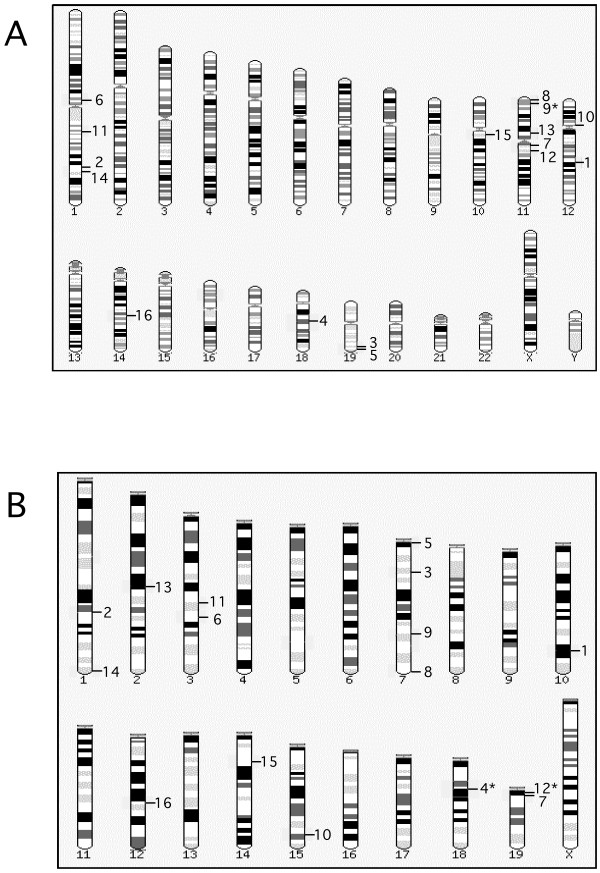
Results: I have compiled a detailed list of the Synaptotagmin genes of Caenorhabditis, Anopheles, Drosophila, Ciona, Danio, Fugu, Mus, Homo, Arabidopsis and Oryza by examining genomic and transcript sequences from public sequence databases together with some transcript sequences obtained by cDNA library screening and RT-PCR. I have compared all of the genes and investigated the relationship between plant Synaptotagmins and their non-Synaptotagmin counterparts.

Conclusions: I have identified and compared 98 Synaptotagmin genes from 10 sequenced genomes. Detailed comparison of transcript sequences reveals abundant and complex variation in Synaptotagmin gene expression and indicates the presence of Synaptotagmin genes in all animals and land plants. Amino acid sequence comparisons indicate patterns of conservation and diversity in function. Phylogenetic analysis shows the origin of Synaptotagmins in multicellular eukaryotes and their great diversification in animals. Synaptotagmins occur in land plants and animals in combinations of 4-16 in different species. The detailed delineation of the Synaptotagmin genes presented here, will allow easier identification of Synaptotagmins in future. Since the functional roles of many of these genes are unknown, this gene collection provides a useful resource for future studies.


Figures

Figure 1
Figure 1
Chromosomal locations of Homo and Mus Syts I have labelled ideograms produced from blast search results at Ensembl [25] with the locations of Syt1-Syt16. (A) Homo. (B) Mus. Asterisks indicate loci with overlapping antisense transcription.
Figure 2
Figure 2
Cladogram tree of Syts Syts are identified on the right. Mus and Homo Syts are identified with names and are bracketed. Arabidopsis Syts are identified with names, following the nomenclature of Fukuda [14].
Figure 3
Figure 3
N-terminal regions of Syts Syts are identified on the left. Mus and Homo Syts are are bracketed and named. Arabidopsis Syts are named following the nomenclature of Fukuda [14]. Amino acid sequence length is indicated on top. Putative transmembrane regions are indicated with a yellow background. Intron positions are indicated by red vertical lines. Regions of alternative splicing or RNA editing are enclosed by red boxes. The main branches of Syts are separated by horizontal blue lines. Similarity between members of a main branch is indicated with a coloured background. A motif common to Syt 15, Syt9, Syt10, Syt6 and Syt3 is indicated in blue in fig. 4.
Figure 4
Figure 4
N-terminal regions of Syts Syts are identified on the left. Mus and Homo Syts are are bracketed and named. Arabidopsis Syts are named following the nomenclature of Fukuda [14]. Amino acid sequence length is indicated on top. Putative transmembrane regions are indicated with a yellow background. Intron positions are indicated by red vertical lines. Regions of alternative splicing or RNA editing are enclosed by red boxes. The main branches of Syts are separated by horizontal blue lines. Similarity between members of a main branch is indicated with a coloured background. A motif common to Syt 15, Syt9, Syt10, Syt6 and Syt3 is indicated in blue in fig. 4.
Figure 5
Figure 5
N-terminal regions of Syts Syts are identified on the left. Mus and Homo Syts are are bracketed and named. Arabidopsis Syts are named following the nomenclature of Fukuda [14]. Amino acid sequence length is indicated on top. Putative transmembrane regions are indicated with a yellow background. Intron positions are indicated by red vertical lines. Regions of alternative splicing or RNA editing are enclosed by red boxes. The main branches of Syts are separated by horizontal blue lines. Similarity between members of a main branch is indicated with a coloured background. A motif common to Syt 15, Syt9, Syt10, Syt6 and Syt3 is indicated in blue in fig. 4.
Figure 6
Figure 6
C2A to C-terminal regions of Syts Syts are identified on the left. Mus and Homo Syts are are bracketed and named. Arabidopsis Syts are named following the nomenclature of Fukuda [14]. Amino acid sequence length is indicated on top. Intron positions are indicated by red vertical lines. Regions of alternative splicing or RNA editing are enclosed by red boxes. The main branches of Syts are separated by horizontal blue lines. Similarity between members of a main branch is indicated with a coloured background. The calcium coordinating positions of Syt1 and Syt3 [37,38] are indicated by a yellow background. Positions with greater than 90% conservation are indicated with a purple background.
Figure 7
Figure 7
C2A to C-terminal regions of Syts Syts are identified on the left. Mus and Homo Syts are are bracketed and named. Arabidopsis Syts are named following the nomenclature of Fukuda [14]. Amino acid sequence length is indicated on top. Intron positions are indicated by red vertical lines. Regions of alternative splicing or RNA editing are enclosed by red boxes. The main branches of Syts are separated by horizontal blue lines. Similarity between members of a main branch is indicated with a coloured background. The calcium coordinating positions of Syt1 and Syt3 [37,38] are indicated by a yellow background. Positions with greater than 90% conservation are indicated with a purple background.
Figure 8
Figure 8
C2A to C-terminal regions of Syts Syts are identified on the left. Mus and Homo Syts are are bracketed and named. Arabidopsis Syts are named following the nomenclature of Fukuda [14]. Amino acid sequence length is indicated on top. Intron positions are indicated by red vertical lines. Regions of alternative splicing or RNA editing are enclosed by red boxes. The main branches of Syts are separated by horizontal blue lines. Similarity between members of a main branch is indicated with a coloured background. The calcium coordinating positions of Syt1 and Syt3 [37,38] are indicated by a yellow background. Positions with greater than 90% conservation are indicated with a purple background.
Figure 9
Figure 9
RNase protection analysis of 5'UTS region of Rattus Syt1 (A) 5'UTS probe aj617620. (B) 5'UTS probe aj617621. (C) 5'UTS probe aj617622. Lane 1: Rattus norvegicus brain mRNA. Lane 2: Rattus rattus brain mRNA. The uppermost bands are full-length products from mRNA transcripts which match the input probe across its whole length. Shorter products result from partially matching mRNA transcripts.
Figure 10
Figure 10
Cladogram tree of all sequences Sequences are identified on the right. Mus and Homo Syts are named and bracketed. Arabidopsis Syts are named following the nomenclature of Fukuda [14]. Yeast tricalbins are named and bracketed.

References

    1. Perin MS, Fried VA, Mignery GA, Jahn R, Südhof TC. Phospholipid binding by a synaptic vesicle protein homologous to the regulatory region of protein kinase C. Nature. 1990;345:260–263. doi: 10.1038/345260a0. - DOI - PubMed
    1. Geppert M, Archer BT, III, Südhof TC. Synaptotagmin II a novel differentially distributed form of synaptotagmin. J Biol Chem. 1991;266:13548–13552. - PubMed
    1. Mizuta M, Inagaki N, Nemoto Y, Matsukura S, Takahashi M, Seino S. Synaptotagmin III is a novel isoform of rat synaptotagmin expressed in endocrine and neuronal cells. J Biol Chem. 1994;269:11675–11678. - PubMed
    1. Hillbush BS, Morgan JI. A third synaptotagmin gene, Syt3, in the mouse. Proc Natl Acad Sci. 1994;91:8195–8199. - PMC - PubMed
    1. Craxton M, Goedert M. Synaptotagmin V: a novel synaptotagmin isoform expressed in rat brain. FEBS Lett. 1995;361:196–200. doi: 10.1016/0014-5793(95)00176-A. - DOI - PubMed

Publication types

MeSH terms