. 2004;5(7):R49.
doi: 10.1186/gb-2004-5-7-r49. Epub 2004 Jun 29.

Systematic quantification of gene interactions by phenotypic array analysis

Affiliations

Systematic quantification of gene interactions by phenotypic array analysis

John L Hartman 4th et al. Genome Biol. 2004.

Abstract

A phenotypic array method, developed for quantifying cell growth, was applied to the haploid and homozygous diploid yeast deletion strain sets. A growth index was developed to screen for non-additive interacting effects between gene deletion and induced perturbations. From a genome screen for hydroxyurea (HU) chemical-genetic interactions, 298 haploid deletion strains were selected for further analysis. The strength of interactions was quantified using a wide range of HU concentrations affecting reference strain growth. The selectivity of interaction was determined by comparison with drugs targeting other cellular processes. Bio-modules were defined as gene clusters with shared strength and selectivity of interaction profiles. The functions and connectivity of modules involved in processes such as DNA repair, protein secretion and metabolic control were inferred from their respective gene composition. The work provides an example of, and a general experimental framework for, quantitative analysis of gene interaction networks that buffer cell growth.


Figures

Figure 1
Figure 1
Model for classifying interactions as additive or non-additive. The interaction of effects between gene deletion and a second perturbation is quantified by comparison between the reference strain and each deletion strain over a range of perturbation-induced effects. Six hypothetical deletion strains are depicted to illustrate the contrast between additive and non-additive interaction. (a) The 'phenotypic slope' of the reference strain (filled circles) defines the effect of perturbation on the reference strain. The effect of gene deletion is determined in the absence of perturbation, and typically has either no effect (strains 1, 3, and 5) (filled square) or a negative effect (strains 2, 4, and 6) (open square) on growth. (b) Additive gene interactions are defined by the phenotypic slope of the deletion strain being parallel to that of the reference strain, across a range of perturbations (strains 1 and 2). (c,d) Non-additive gene interactions can be either synergistic (c), giving a phenotypic slope of greater absolute value (strains 3 and 4), or antagonistic (d), giving a phenotypic slope of lesser absolute value (strains 5 and 6). Two types of antagonistic interactions are depicted in (d). Deletion strain 5 is absolutely antagonistic to the perturbation (for example, drug resistance due to loss of a transporter required for drug uptake), whereas deletion strain 6 is antagonistic only when the inhibitory effect of the deletion alone is greater than that of the perturbation alone (for example, drug resistance due to deletion of the gene encoding the protein target of drug inhibition).
Figure 2
Figure 2
Overview of phenotypic array and growth index (GI). Growth is quantified by image analysis of cellular arrays and plotted against time to calculate area under the growth curve (AUGC), which is used to calculate the growth index (GI) a predictor of non-additive gene interaction. (a-f) Raw data from growth of a single deletion strain source plate (plate 4, see Additional data file 7) at three different times, 26 h (a,b), 46 h (b,e), and 94 h (c,f), and under two different conditions, synthetic complete medium without HU (a-c) and with 150 mM HU (d-f). Only three strains (E2, E10 and G2) were selected for further testing from this plate, having GI < -5.8. (g,h) Growth curves (red) for all 94 strains are plotted, along with the mean growth (blue dashed line) from 196 replicates of the reference strain, in (g) the absence or (h) the presence of 150 mM HU. (i) The GI equation is a z-statistic, where the difference between normalized growth of the deletion and mean of reference strains is the signal for non-additive interaction, and the standard deviation of the reference strain growth is the noise. [], concentration of HU (mM); ds, deletion strain; ref, reference strain; n, number of replicates; SD, standard deviation. (j) The distribution of GI scores for all strains (except 64 strains with unperturbed AUGC < 600, see Additional data files 2, 7) from the 50 mM (red triangles) and 150 mM (blue crosses) HU screens (n = 4,788, bin size = 0.5), along with the distribution of reference strain GI values (dashed lines) (n = 192, bin size = 1; range: -2.41 < GI < 2.15). REF, reference strain. (k) Plot of intrinsic growth (AUGC when unexposed to drugs) vs phenotypic interaction with HU (GI) is shown for all deletion strains. Dashed lines indicate the GI cutoffs used to select synergistic (GI < -5.8) or antagonistic (GI > 5.8) interactions for further testing.
Figure 3
Figure 3
Modularity in buffering growth against HU inhibition is exemplified by genes with related functions having similar strength of interactions. AUGC is plotted vs HU concentration in all cases. (a) Genes of the RAD52 epistasis group. Note the uniformly strong synergistic interaction (see Figure 1c), with the exception of RAD59. (b) Genes of the vacuolar H+-ATPase. Note the additive interactions (see Figure 1b). (c) Genes involved in vacuolar trafficking. The stronger interactions are shown in green. (d) Assorted examples of antagonistic interactions (see text and Additional data file 12). Note that gene deletions often, in general, antagonize the HU phenotype at concentrations where the growth inhibitory effect of the deletion is greater than the inhibitory effect of HU on the reference strain (see Figure 1d) [28]. REF, reference strain BY4741 (see Materials and methods).
Figure 4
Figure 4
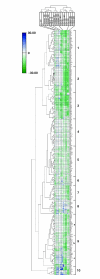
Modularity of gene interactions. The 298 HU-selected strains were perturbed with other drugs, and GI values were analyzed by hierarchical clustering. The color intensity represents the magnitude of the GI, green being negative (synergistic effect of gene deletion), but note that the range of color intensity may be different for each perturbation (see Figure 2j and Additional data file 3) because the phenotypic noise, determined for replicates of the reference strain, is measured uniquely for each perturbation (see Figure 2i). Gene clusters were given numbers (on right) for ease of referral, based subjectively on their appearance with respect to the dendrogram branches (see also Additional data file 10). GI values are reported in Additional data file 9. The first two columns (C) indicate the GI for unperturbed deletion strains (synthetic complete media, no drug). '_gen' indicates data from the original genomic screen. Otherwise, data are from a single retest of selected strains. The other columns indicate drugs used for perturbation as follows (numbers following the abbreviation indicate the concentration): miconaz, miconazole (nM); TBHP, t-butyl hydroperoxide (mM); cyclohex, cycloheximide (ng/ml); HU, hydroxyurea (mM); cisplat, cisplatin (μM). The drug perturbations and the growth phenotypes for the reference strain under each perturbation are given in Additional data file 1. Gene names are from SGD and descriptions can be found in Additional data file 10 [47].
Figure 5
Figure 5
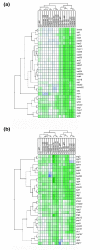
An enlarged view of clusters 2 and 3 from Figure 4. (a) Cluster 2 identifies a group of strains indicating strong and selective synergism between gene deletion and DNA-damaging perturbations. The set is highly enriched for DNA repair genes, and, in particular, homologous recombination genes. (b) Cluster 3 identifies genes required for growth under all perturbations tested, and is enriched for genes involved in vesicular trafficking, most notably vacuolar protein sorting. Gene names are from SGD and descriptions can be found in Additional data file 10 [47]. Abbreviations as in Figure 4.
Figure 6
Figure 6
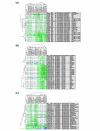
Pathway modularity, assessed by subclustering of GI data involving genes of known function for protein trafficking or DNA replication. The 298 HU-selected deletion strains were classified, based on literature annotations of their respective gene functions, into cellular pathways (see Table 2 and Additional data file 11) and sub-clustered accordingly. Color intensity corresponds to the GI (see Figure 4 for scale). Grp refers to the cluster designation from Figure 4. (a) Growth profiles from strains carrying deletions of vesicular trafficking genes. Note the several vacuolar protein sorting mutants (vps and pep), which share a distinctive phenotypic profile, even among other genes required for protein secretion and trafficking [30]. (b-c) Clustered growth profiles from strains carrying deletions in genes important for DNA replication, divided into DNA repair and chromosome dynamics (see text for further details).
Figure 7
Figure 7
A speculative model for buffering against perturbation of deoxynucleoside triphosphate (dNTP) synthesis, based on interconnected genetic modules found to interact with HU. The growth inhibitory effects of HU are shown in red. Modules - sets of related genes with similar selectivity and/or strength of interactions - are indicated by green numbers (see below). Connections between modules are based on the literature about the respective genes (see Results and Discussion sections). The proposed metabolic regulation of de novo dNTP synthesis is indicated by bold module connections, based on recent discovery of a 'high-flux backbone' in E. coli [60]. Dashed lines represent related, but more speculative connections. Interaction index values, measuring the strength of interaction for all genes listed below are given in Additional data files 11, 12. Selectivity can be visualized in Figures 4-6 and Additional data file 6. 1, Mitochondrial function, SSQ1, ATP5, TOM37, RML2; 2, retrograde signaling, RTG1, RTG2, RTG3, MKS1; 3, threonine synthesis, AAT2, HOM3, HOM2, HOM6, THR1, THR4; 4, permease trafficking, LST4, LST7; 5, adenosine metabolism, ADO1, ADK1, APT1; 6, cell-cycle checkpoint, MRC1, RAD24, RAD17, DDC1, RAD9; 7, homologous recombination MRE11, RAD52, XRS2, RAD50, RAD51, RAD54, RAD55, RAD57; 8, single-strand DNA repair TOP3, SGS1, MUS81, MMS4, HPR5; (9) sister chromatic cohesion, CTF4, CTF8, DCC1; 10, microtubule associated, PAC10, YKE2, BIM1, KAR3, CIK1; 11, protein secretion VPS15, VPS33, VPS34, VPS45, VPS9, VPS3, VPS16, PEP7, PEP12, CHC1, CLC1, END3, VID22, VID31/DEF1; 12, membrane biosynthesis, ERG3, SCS7.

Similar articles

Cited by

References

    1. Badano JL, Katsanis N. Beyond Mendel: an evolving view of human genetic disease transmission. Nat Rev Genet. 2002;3:779–789. doi: 10.1038/nrg910. - DOI - PubMed
    1. Moore JH. The ubiquitous nature of epistasis in determining susceptibility to common human diseases. Hum Hered. 2003;56:73–82. doi: 10.1159/000073735. - DOI - PubMed
    1. Mackay TF. The genetic architecture of quantitative traits. Annu Rev Genet. 2001;35:303–339. doi: 10.1146/annurev.genet.35.102401.090633. - DOI - PubMed
    1. Barton NH, Keightley PD. Understanding quantitative genetic variation. Nat Rev Genet. 2002;3:11–21. doi: 10.1038/nrg700. - DOI - PubMed
    1. Hartman JL, Garvik B, Hartwell L. Principles for the buffering of genetic variation. Science. 2001;291:1001–1004. doi: 10.1126/science.291.5506.1001. - DOI - PubMed

Publication types

MeSH terms

LinkOut - more resources