Mechanokinetics of rapid tension recovery in muscle: the Myosin working stroke is followed by a slower release of phosphate
- PMID: 15240478
- PMCID: PMC1304365
- DOI: 10.1529/biophysj.103.037788
Mechanokinetics of rapid tension recovery in muscle: the Myosin working stroke is followed by a slower release of phosphate
Abstract
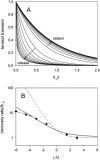
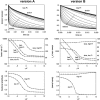
Crystallographic and biochemical evidence suggests that the myosin working stroke that generates force in muscle is accompanied by the release of inorganic phosphate (Pi), but the order and relative speed of these transitions is not firmly established. To address this problem, the theory of A. F. Huxley and R. M. Simmons for the length-step response is averaged over elastic strains imposed by filament structure and extended to include a Pi-release transition. Models of this kind are applied to existing tension-recovery data from length steps at different phosphate concentrations, and from phosphate jumps upon release of caged phosphate. This body of data is simulated by the model in which the force-generating event is followed by Pi release. A version in which the Pi-release transition is slow provides a better fit than a version with rapid Pi release and a slow transition preceding force generation. If Pi is released before force generation, the predicted rate of slow recovery increases with the size of the step, which is not observed. Some implications for theories of muscle contraction are discussed.
Figures


Similar articles
-
A new mechanokinetic model for muscle contraction, where force and movement are triggered by phosphate release.J Muscle Res Cell Motil. 2014 Dec;35(5-6):295-306. doi: 10.1007/s10974-014-9391-z. Epub 2014 Oct 16. J Muscle Res Cell Motil. 2014. PMID: 25319769
-
Strain-dependent modulation of phosphate transients in rabbit skeletal muscle fibers.Biophys J. 1997 Apr;72(4):1780-91. doi: 10.1016/S0006-3495(97)78824-6. Biophys J. 1997. PMID: 9083682 Free PMC article.
-
Effect of inorganic phosphate on the force and number of myosin cross-bridges during the isometric contraction of permeabilized muscle fibers from rabbit psoas.Biophys J. 2008 Dec 15;95(12):5798-808. doi: 10.1529/biophysj.108.130435. Epub 2008 Oct 3. Biophys J. 2008. PMID: 18835889 Free PMC article.
-
Coupling between phosphate release and force generation in muscle actomyosin.Philos Trans R Soc Lond B Biol Sci. 2004 Dec 29;359(1452):1913-20. doi: 10.1098/rstb.2004.1561. Philos Trans R Soc Lond B Biol Sci. 2004. PMID: 15647167 Free PMC article. Review.
-
X-ray diffraction studies of the contractile mechanism in single muscle fibres.Philos Trans R Soc Lond B Biol Sci. 2004 Dec 29;359(1452):1883-93. doi: 10.1098/rstb.2004.1557. Philos Trans R Soc Lond B Biol Sci. 2004. PMID: 15647164 Free PMC article. Review.
Cited by
-
Three distinct actin-attached structural states of myosin in muscle fibers.Biophys J. 2012 Mar 7;102(5):1088-96. doi: 10.1016/j.bpj.2011.11.4027. Epub 2012 Mar 6. Biophys J. 2012. PMID: 22404931 Free PMC article.
-
Force and power generating mechanism(s) in active muscle as revealed from temperature perturbation studies.J Physiol. 2010 Oct 1;588(Pt 19):3657-70. doi: 10.1113/jphysiol.2010.194001. J Physiol. 2010. PMID: 20660565 Free PMC article. Review.
-
Reconciling the working strokes of a single head of skeletal muscle myosin estimated from laser-trap experiments and crystal structures.Proc Natl Acad Sci U S A. 2006 Jan 31;103(5):1278-82. doi: 10.1073/pnas.0506272103. Epub 2006 Jan 20. Proc Natl Acad Sci U S A. 2006. PMID: 16428290 Free PMC article.
-
Poorly understood aspects of striated muscle contraction.Biomed Res Int. 2015;2015:245154. doi: 10.1155/2015/245154. Epub 2015 Apr 16. Biomed Res Int. 2015. PMID: 25961006 Free PMC article. Review.
-
Temperature jump induced force generation in rabbit muscle fibres gets faster with shortening and shows a biphasic dependence on velocity.J Physiol. 2010 Feb 1;588(Pt 3):479-93. doi: 10.1113/jphysiol.2009.179200. Epub 2009 Nov 30. J Physiol. 2010. PMID: 19948657 Free PMC article.
References
-
- Conibear, P. B., C. R. Bagshaw, P. G. Fajer, M. Kovacs, and A. Malnasi-Csizmadia. 2003. Myosin cleft movement and its coupling to actomyosin dissociation. Nat. Struct. Biol. 10:831–835. - PubMed
-
- Cook, C. S., M. Ashley-Ross, D. Syme, Y. E. Goldman, and L. C. Rome. 1997. Trading force for speed: cross-bridge kinetics in superfast fibers. Biophys. J. 72:A128. (Abstr.)
-
- Cooke, R. 1997. The mechanism of muscle contraction. CRC Crit. Rev. Biochem. 21:53–118. - PubMed
Publication types
MeSH terms
Substances
Grants and funding
LinkOut - more resources
Full Text Sources
Research Materials
Miscellaneous

