. 2004 Jul;87(1):615-21.
doi: 10.1529/biophysj.104.040212.

A nanosensor for transmembrane capture and identification of single nucleic Acid molecules

Affiliations

A nanosensor for transmembrane capture and identification of single nucleic Acid molecules

Jonathan Nakane et al. Biophys J. 2004 Jul.

Erratum in

  • Biophys J. 2004 Nov;87(5):3618

Abstract

We have engineered a nanosensor for sequence-specific detection of single nucleic acid molecules across a lipid bilayer. The sensor is composed of a protein channel nanopore (alpha-hemolysin) housing a DNA probe with an avidin anchor at the 5' end and a nucleotide sequence designed to noncovalently bind a specific single-stranded oligonucleotide at the 3' end. The 3' end of the DNA probe is driven to the opposite side of the pore by an applied electric potential, where it can specifically bind to oligonucleotides. Reversal of the applied potential withdraws the probe from the pore, dissociating it from a bound oligonucleotide. The time required for dissociation of the probe-oligonucleotide duplex under this force yields identifying characteristics of the oligonucleotide. We demonstrate transmembrane detection of individual oligonucleotides, discriminate between molecules differing by a single nucleotide, and investigate the relationship between dissociation time and hybridization energy of the probe and analyte molecules. The detection method presented in this article is a candidate for in vivo single-molecule detection and, through parallelization in a synthetic device, for genotyping and global transcription profiling from small samples.


Figures

FIGURE 1
FIGURE 1
Nanosensor schematic (not to scale). An α-hemolysin nanopore is self-assembled in a lipid bilayer formed across a ∼50-μm opening in a Teflon tube. The tube, and the baths it opens onto are filled with 1 M KCl pH 8.0. The potential across the bilayer is controlled by an Axopatch 200B patch-clamp amplifier through AgCl electrodes. The biotinylated 5′ end of the probe is bound to avidin on the cis side, preventing the probe from passing through the pore. A 14-nucleotide sequence at the 3′ end of the probe is selected to hybridize to the analyte molecule, shown associated with the probe.
FIGURE 2
FIGURE 2
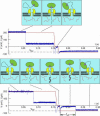
(Upper) Animation and experimental data of an unsuccessful analyte capture. Current is shown in blue; applied potential is shown in red. A +200 mV forward potential is used to capture a probe in the pore; probe capture is observable as a decrease in current to ∼25% of the open channel value corresponding to a pore resistance increase from 1 GΩ to 4 GΩ. The potential is then reduced to +10 mV, a potential insufficient to prevent probe exit, and impedance returns to the open channel value. Large current spikes during potential changes are due to capacitance of the lipid bilayer and patch-clamp electronics. (Lower) Animation and experimental data of a successful analyte capture. After probe capture, the potential is again reduced to +10 mV for a short period, but probe exit is now prevented by the bound analyte, and impedance remains at the blocked channel value. The potential is then reversed to −60 mV thus applying a force to withdraw the probe from the pore. After a time toff the probe dissociates from the analyte and the open channel (reverse) current is restored. Statistical analysis of many dissociation events lifetimes (toff) at several reverse potentials (Vrev) yields identifying characteristics of the analyte molecule.
FIGURE 3
FIGURE 3
Mean time for the probe molecule to escape from the pore to the cis chamber, under small forward applied potentials. Each data point represents the mean of ∼60 escape events. The lines drawn through the data points represent exponential fits to points above and below 10.5 mV. The transition from a diffusion-limited to an exponential barrier-crossing behavior (inset) occurs at a threshold potential Vt = 10.3 mV, calculated from the intersection of exponential fits to the data above and below 10.5 mV. Based on previous work (Meller et al., 2001) we expect escape time in the diffusion-limited regime to have a quadratic relationship to potential, although not enough data points were collected to confirm this. For each potential, two distinct timescales for probe escape are observed as noted in previous work (Bates et al., 2003). Although timescales for escape observed for a 60-mer oligonucleotide by Bates et al. are substantially shorter (165 μs and 3.5 ms) than those observed here, the former were recorded for oligonucleotides without bound avidin, and with no applied potential to counteract entropic recoil. At +10.5 mV applied potential, we observe the timescales of 1.5 ms and 120 ms.
FIGURE 4
FIGURE 4
Probability of probe escape (Pesc) as a function of time for probe bound to the 7c molecule at −55mV potential. The data in the figure represent 417 binding events. Inset a shows the result of a non-negative least-square error fit to Pesc assuming the form formula image The amplitude of the coefficients ai is plotted on the vertical axis, whereas the timescales ti used in the fit are plotted on the horizontal axis. For the 7c molecule data shown in this figure, the dominant timescales are 2.7 ms (with ai = 0.58) and 8.4 ms (ai = 0.24). Inset b shows a similar fit obtained on the Pesc data for the 14pc molecule at −55 mV. Dominant timescales are 100 ms (ai = 0.39) and 1.3 s (ai = 0.34).
FIGURE 5
FIGURE 5
Average measured event lifetimes extracted from non-negative least-square error fits to Pesc(t). Each data point shown in the graph is a coefficient-weighted average of the dominant timescales. Any spurious and poorly resolved short- and long-lived timescales were omitted from the average. The inset shows the timescales for the 10c molecule, with the diameter of the data points representing the relative amplitude of the coefficients. The dotted line separates the dominant timescales included in the average, and the excluded spurious short-lived timescales. Lines drawn through the data in the main graph represent exponential fits, although the rightmost two points for the 10c molecule were not included in the fit (see text). For all molecules, the average event duration decreases with increasing reverse potential. Each data point represents from 60 to 500 successful analyte captures. Error bars for two of the 14pc points have been omitted for clarity: they are +4.2 ms, −2.7 ms at −75 mV; and +3.6 ms, −2.0 ms at −80 mV. Errors bars were calculated by applying a bootstrap algorithm to the collected data to get estimates for all the coefficients ai, with each peak in the coefficient graph then fit to a Gaussian curve to estimate the mean and standard error of each peak; the composite error bars were found by adding the errors in the combined timescales in quadrature.
FIGURE 6
FIGURE 6
Intercept (at V = +10 mV) of the natural logarithm of the average event lifetime versus applied potential, plotted against the expected binding energy for each molecule, calculated from Mfold (Zuker, 2003). The intercept (at zero effective applied force) of the logarithm of the bond lifetime, as given in Eq. 4, is formula image Plotting this against the molecule binding energy in units of kbT as predicted by Mfold is expected to yield a linear relationship with a slope of 1. A linear fit through the data yields a slope of 0.75 +38, −0.3.

References

    1. Akeson, M., D. Branton, J. J. Kasianowicz, E. Brandin, and D. W. Deamer. 1999. Microsecond timescale discrimination among polycytidylic acid, polyadenylic acid, and polyuridylic acid as homopolymers or as segments within single RNA molecules. Biophys. J. 77:3227–3233. - PMC - PubMed
    1. Bates, M., M. Burns, and A. Meller. 2003. Dynamics of DNA molecules in a membrane channel probed by active control techniques. Biophys. J. 84:2366–2372. - PMC - PubMed
    1. Evans, E. 2001. Probing the relation between force lifetime and chemistry in single molecular bonds. Annu. Rev. Biophys. Biomol. Struct. 30:105–128. - PubMed
    1. Henrickson, S. E., M. Misakian, B. Robertson, and J. J. Kasianowicz. 2000. Driven DNA transport into an asymmetric nanometer-scale pore. Phys. Rev. Lett. 85:3057–3060. - PubMed
    1. Howorka, S., S. Cheley, and H. Bayley. 2001a. Sequence-specific detection of individual DNA strands using engineered nanopores. Nat. Biotechnol. 19:636–639. - PubMed

Publication types

MeSH terms