Odorant-evoked nitric oxide signals in the antennal lobe of Manduca sexta
- PMID: 15240798
- PMCID: PMC1794326
- DOI: 10.1523/JNEUROSCI.0710-04.2004
Odorant-evoked nitric oxide signals in the antennal lobe of Manduca sexta
Abstract
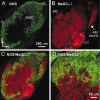
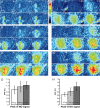
The gaseous signaling molecule nitric oxide (NO) can affect the activities of neurons and neural networks in many different systems. The strong expression of NO synthase (NOS) in the primary synaptic neuropil (the antennal lobe in insects and the olfactory bulb in vertebrates) of the olfactory system of most organisms, and the unique spheroidal geometry of olfactory glomeruli in those neuropils, have led to suggestions that NO signaling is important for processing olfactory information. No direct evidence exists, however, that NO signals are produced in olfactory glomeruli. We investigated the production of NO in the antennal lobe of the moth, Manduca sexta, by using immunocytochemistry and real-time optical imaging with a NO-sensitive fluorescent marker, diaminofluorescein diacetate. We confirmed that NOS was expressed in the axons of olfactory receptor neurons projecting to all glomeruli. Soluble guanylyl cyclase, the best characterized target of NO, was found in a subset of postsynaptic antennal lobe neurons that included projection neurons, a small number of GABA-immunoreactive neurons, and a serotonin-immunoreactive neuron. We found that odorant stimulation evoked NO signals that were reproducible and spatially focused. Different odorants evoked spatially distinct patterns of NO production. Increased concentrations of pheromone and plant odorants caused increases in peak signal intensity. Increased concentrations of plant odorants also evoked a dramatic increase in signal area. The results of these experiments show clearly that odorant stimulation can evoke NO production in the olfactory system. The NO signals produced are likely to play an important role in processing olfactory information.
Figures


Similar articles
-
Inhibition of nitric oxide and soluble guanylyl cyclase signaling affects olfactory neuron activity in the moth, Manduca sexta.J Comp Physiol A Neuroethol Sens Neural Behav Physiol. 2007 Jul;193(7):715-28. doi: 10.1007/s00359-007-0227-9. Epub 2007 Jun 6. J Comp Physiol A Neuroethol Sens Neural Behav Physiol. 2007. PMID: 17551736 Free PMC article.
-
Expression of nitric oxide synthase and soluble guanylyl cyclase in the developing olfactory system of Manduca sexta.J Comp Neurol. 2000 Jun 26;422(2):191-205. doi: 10.1002/(sici)1096-9861(20000626)422:2<191::aid-cne4>3.0.co;2-c. J Comp Neurol. 2000. PMID: 10842227
-
Neuron-glia communication via nitric oxide is essential in establishing antennal-lobe structure in Manduca sexta.Dev Biol. 2001 Dec 15;240(2):326-39. doi: 10.1006/dbio.2001.0463. Dev Biol. 2001. PMID: 11784067
-
Glomerular interactions in olfactory processing channels of the antennal lobes.J Comp Physiol A Neuroethol Sens Neural Behav Physiol. 2013 Nov;199(11):929-46. doi: 10.1007/s00359-013-0842-6. Epub 2013 Jul 28. J Comp Physiol A Neuroethol Sens Neural Behav Physiol. 2013. PMID: 23893248 Free PMC article. Review.
-
The roles of local interneurons in the processing of olfactory information in the antennal lobes of the moth Manduca sexta.Acta Biol Hung. 1992;43(1-4):167-74. Acta Biol Hung. 1992. PMID: 1299109 Review.
Cited by
-
Nitric oxide affects short-term olfactory memory in the antennal lobe of Manduca sexta.J Exp Biol. 2013 Sep 1;216(Pt 17):3294-300. doi: 10.1242/jeb.086694. Epub 2013 May 16. J Exp Biol. 2013. PMID: 23685973 Free PMC article.
-
Neurochemical architecture of the central complex related to its function in the control of grasshopper acoustic communication.PLoS One. 2011;6(9):e25613. doi: 10.1371/journal.pone.0025613. Epub 2011 Sep 28. PLoS One. 2011. PMID: 21980504 Free PMC article.
-
Nitric oxide contributes to high-salt perception in a blood-sucking insect model.Sci Rep. 2017 Nov 14;7(1):15551. doi: 10.1038/s41598-017-15861-0. Sci Rep. 2017. PMID: 29138480 Free PMC article.
-
A review of the actions of Nitric Oxide in development and neuronal function in major invertebrate model systems.AIMS Neurosci. 2019 Aug 19;6(3):146-174. doi: 10.3934/Neuroscience.2019.3.146. eCollection 2019. AIMS Neurosci. 2019. PMID: 32341974 Free PMC article. Review.
-
Inhibition of nitric oxide and soluble guanylyl cyclase signaling affects olfactory neuron activity in the moth, Manduca sexta.J Comp Physiol A Neuroethol Sens Neural Behav Physiol. 2007 Jul;193(7):715-28. doi: 10.1007/s00359-007-0227-9. Epub 2007 Jun 6. J Comp Physiol A Neuroethol Sens Neural Behav Physiol. 2007. PMID: 17551736 Free PMC article.
References
-
- Alonso JR, Porteros A, Crespo C, Arevalo R, Brinon JG, Weruaga E, Aijon J (1998) Chemical anatomy of the macaque monkey olfactory bulb: NADPH-diaphorase/nitric oxide synthase activity. J Comp Neurol 402: 419-434. - PubMed
-
- Bredt DS, Glatt CE, Hwang PM, Fotuhi M, Dawson TM, Snyder SH (1991) Nitric oxide synthase protein and mRNA are discretely localized in neuronal populations of the mammalian CNS together with NADPH diaphorase. Neuron 7: 615-624. - PubMed
-
- Breer H, Shepherd GM (1993) Implications of the NO/cGMP system for olfaction. Trends Neurosci 16: 5-9. - PubMed
-
- Broillet MC, Firestein S (1996) Direct activation of the olfactory cyclic nucleotide-gated channel through modification of sulfhydryl groups by NO compounds. Neuron 16: 377-385. - PubMed
-
- Carlsson MA, Hansson BS (2003) Dose-response characteristics of glomerular activity in the moth antennal lobe. Chem Senses 28: 269-278. - PubMed
Publication types
MeSH terms
Substances
Grants and funding
LinkOut - more resources
Full Text Sources
