. 2004 Sep;15(9):4089-104.
doi: 10.1091/mbc.e04-04-0306. Epub 2004 Jul 7.

Nutritional homeostasis in batch and steady-state culture of yeast

Affiliations

Nutritional homeostasis in batch and steady-state culture of yeast

Alok J Saldanha et al. Mol Biol Cell. 2004 Sep.

Abstract

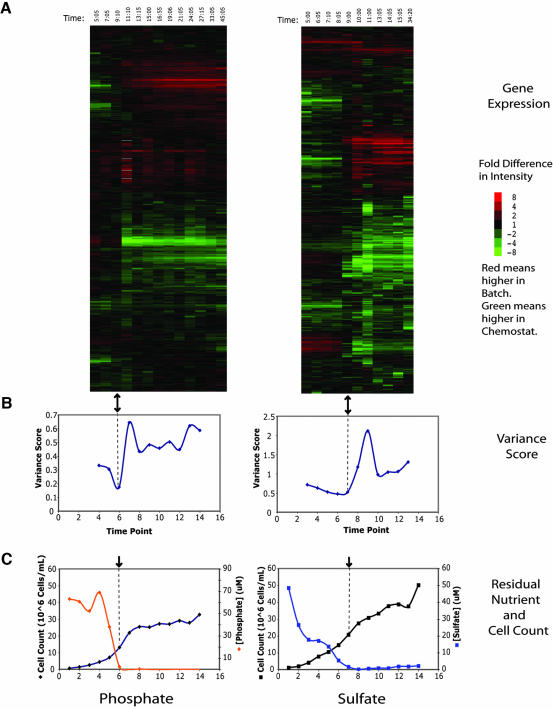
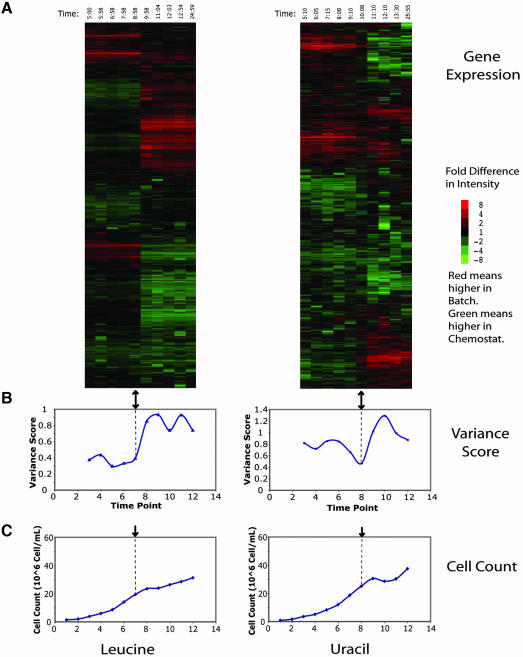
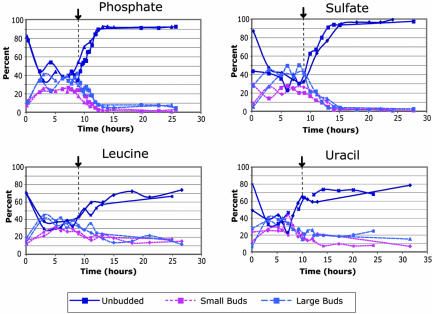
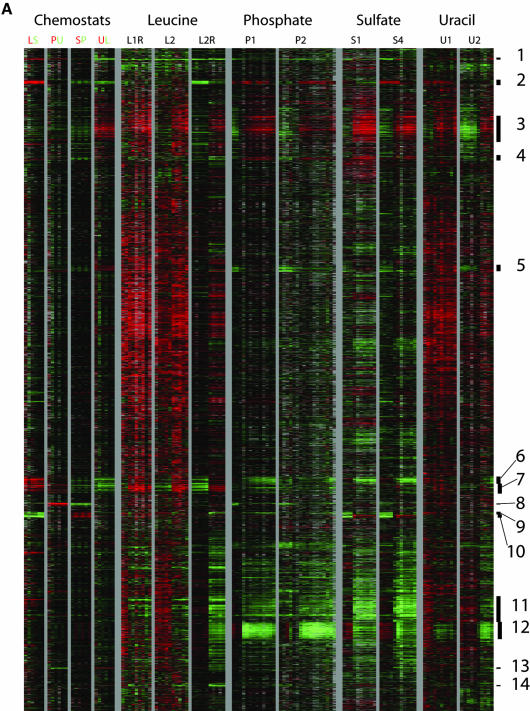
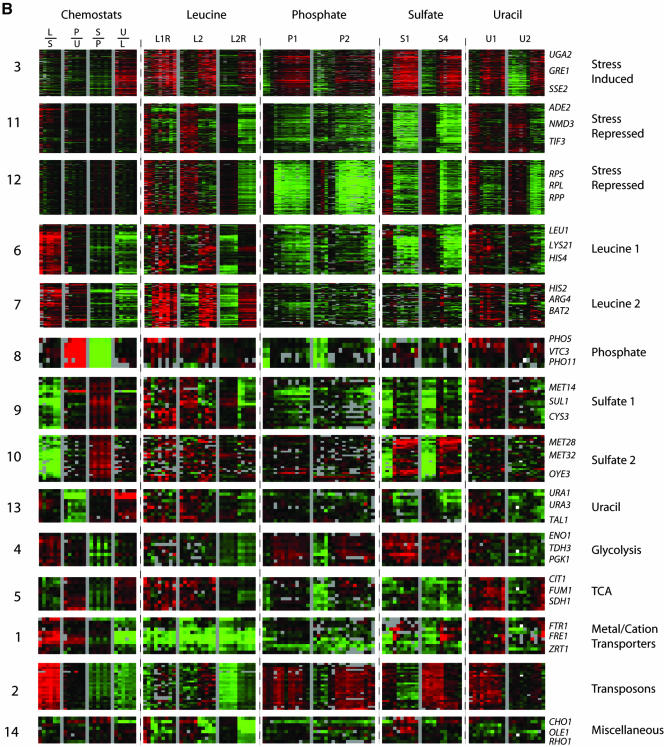
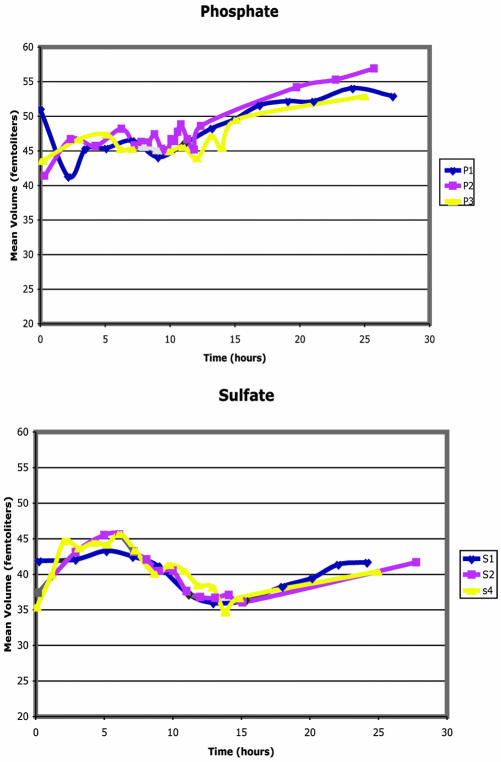
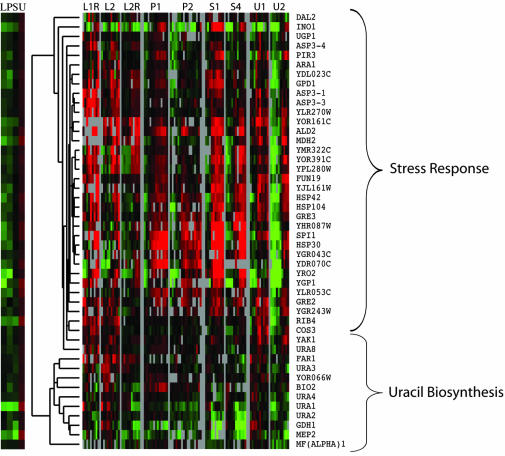
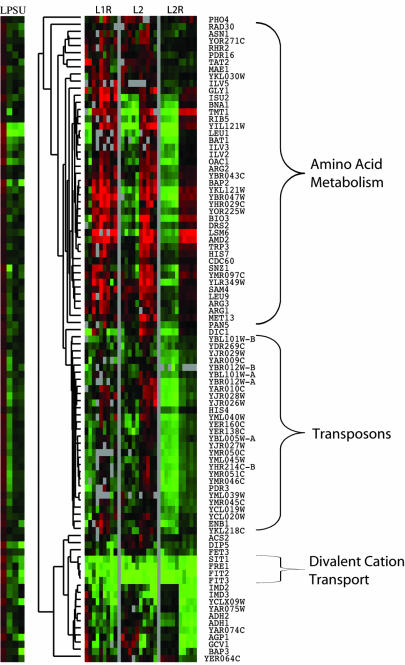
We studied the physiological response to limitation by diverse nutrients in batch and steady-state (chemostat) cultures of S. cerevisiae. We found that the global pattern of transcription in steady-state cultures in limiting phosphate or sulfate is essentially identical to that of batch cultures growing in the same medium just before the limiting nutrient is completely exhausted. The massive stress response and complete arrest of the cell cycle that occurs when nutrients are fully exhausted in batch cultures is not observed in the chemostat, indicating that the cells in the chemostat are "poor, not starving." Similar comparisons using leucine or uracil auxotrophs limited on leucine or uracil again showed patterns of gene expression in steady-state closely resembling those of corresponding batch cultures just before they exhaust the nutrient. Although there is also a strong stress response in the auxotrophic batch cultures, cell cycle arrest, if it occurs at all, is much less uniform. Many of the differences among the patterns of gene expression between the four nutrient limitations are interpretable in light of known involvement of the genes in stress responses or in the regulation or execution of particular metabolic pathways appropriate to the limiting nutrient. We conclude that cells adjust their growth rate to nutrient availability and maintain homeostasis in the same way in batch and steady state conditions; cells in steady-state cultures are in a physiological condition normally encountered in batch cultures.


Figures

Figure 1.
Figure 1.
Global cluster analysis of phosphate and sulfate expression data. (A) Clustergram of genome-wide microarray data for phosphate (P1) and sulfate (S4) time courses. The array indicated by the black arrow has similar representation of transcripts in both channels. It should be noted that the data have not been centered, thus allowing the accurate representation of a constant bias in expression, but also increasing sensitivity to systematic bias. Time points were taken at intervals of approximately 2 h. Each row corresponds to a single gene and each column to a single array. The columns are arranged in order of increasing time. Red values indicate higher expression in the batch, and green values indicate higher expression in the chemostat. The intensity of the color is determined by the fold change and is indicated by the color bar to the right. (B) Variance score has a minimum near the array identified by cluster analysis, shown here with the black arrow. The variance score is a measure of the deviation of the array from equal representation of all transcripts in both channels and is calculated as the average of the square of the log ratios. (C) The limiting nutrient becomes undetectable in the filtered media near the time that the transcriptional state becomes comparable.
Figure 2.
Figure 2.
Global cluster analysis of leucine and uracil expression data. Clustergram of genome-wide microarray data for leucine (L2R) and uracil (U2) time courses. Figure was produced as described in Figure 1. Again, there is an array in which the gene expression is most comparable, indicated by the black arrow, and a corresponding minimum in the variance plot.
Figure 3.
Figure 3.
Cell morphology during nutrient-limited batch time courses. Cells were taken at the indicated time points and assayed for cell morphology by light microscopy, as described in Materials and Methods. Cells grown under phosphate and sulfate limitation displayed a more uniform final morphology than under leucine and uracil limitation.
Figure 4.
Figure 4.
Megacluster analysis reveals clusters with distinct regulation. (A) Gene expression data were extracted for nine time courses and four pair-wise chemostat comparisons and clustered using an uncentered Pearson correlation. To the right of the clustergram are indicated 14 clusters of gene with coherent patterns of expression. (B) Summary of clusters identified in megacluster analysis. The log base 2 of the expression ratio for the 14 clusters was plotted as a function of time. The 14 clusters have been grouped by theme. Clusters 3, 11, and 12 show common regulation across the time courses. Clusters 6, 7, 8, 9, 10, and 13 show regulation specific to a particular nutrient, as indicated by name. Clusters 4, 5, 1, 2, and 14 show diverse regulation.
Figure 4.
Figure 4.
Megacluster analysis reveals clusters with distinct regulation. (A) Gene expression data were extracted for nine time courses and four pair-wise chemostat comparisons and clustered using an uncentered Pearson correlation. To the right of the clustergram are indicated 14 clusters of gene with coherent patterns of expression. (B) Summary of clusters identified in megacluster analysis. The log base 2 of the expression ratio for the 14 clusters was plotted as a function of time. The 14 clusters have been grouped by theme. Clusters 3, 11, and 12 show common regulation across the time courses. Clusters 6, 7, 8, 9, 10, and 13 show regulation specific to a particular nutrient, as indicated by name. Clusters 4, 5, 1, 2, and 14 show diverse regulation.
Figure 5.
Figure 5.
Cell size during phosphate and sulfate batch limitations. Cell suspensions taken at the indicated times were assayed for cell size using a Beckman Coulter Z2 cell counter. The two limitations consistently showed opposite changes in cell size.
Figure 6.
Figure 6.
Cluster analysis of genes highly expressed in uracil chemostat. Genes were called highly expressed in a particular chemostat by the ring design analysis. Data from the time-course experiments were extracted for the genes on the list and clustered to reveal two major patterns of gene expression, a consistent induction corresponding to the stress response, and no consistent regulation, corresponding to the genes involved in de novo uracil biosynthesis.
Figure 7.
Figure 7.
Cluster analysis of genes highly expressed in leucine chemostat. Genes were called highly expresses in a particular chemostat by the ring design analysis. Data for the leucine batch time-course experiment were extracted for the genes that were up-regulated in the leucine chemostate, and clustered to reveal three major patterns of expression corresponding to amino acid biosynthesis, transposons, and divalent cation transport, as indicated.

References

    1. Ashburner, M., et al. (2000). Gene ontology: tool for the unification of biology. The Gene Ontology Consortium. Nat. Genet. 25, 25-29. - PMC - PubMed
    1. Boer, V.M., de Winde, J.H., Pronk, J.T., and Piper, M.D. (2003). The genome-wide transcriptional responses of Saccharomyces cerevisiae grown on glucose in aerobic chemostat cultures limited for carbon, nitrogen, phosphorus, or sulfur. J. Biol. Chem. 278, 3265-3274. - PubMed
    1. Carroll, A.S., and O'Shea, E.K. (2002). Pho85 and signaling environmental conditions. Trends Biochem. Sci. 27, 87-93. - PubMed
    1. Chen, P.S., Toribara, T., and Warner, H. (1956). Microdetermination of phosphorus. Anal. Chem. 28, 1756-1758.
    1. Denis-Duphil, M. (1989). Pyrimidine biosynthesis in Saccharomyces cerevisiae: the ura2 cluster gene, its multifunctional enzyme product, and other structural or regulatory genes involved in de novo UMP synthesis. Biochem. Cell Biol. 67, 612-631. - PubMed

Publication types