. 2004 Jul 7;32(12):3581-9.
doi: 10.1093/nar/gkh681. Print 2004.

New strategy for the representation and the integration of biomolecular knowledge at a cellular scale

Affiliations

New strategy for the representation and the integration of biomolecular knowledge at a cellular scale

Roland Barriot et al. Nucleic Acids Res. .

Abstract

The combination of sequencing and post-sequencing experimental approaches produces huge collections of data that are highly heterogeneous both in structure and in semantics. We propose a new strategy for the integration of such data. This strategy uses structured sets of sequences as a unified representation of biological information and defines a probabilistic measure of similarity between the sets. Sets can be composed of sequences that are known to have a biological relationship (e.g. proteins involved in a complex or a pathway) or that share similar values for a particular attribute (e.g. expression profile). We have developed a software, BlastSets, which implements this strategy. It exploits a database where the sets derived from diverse biological information can be deposited using a standard XML format. For a given query set, BlastSets returns target sets found in the database whose similarity to the query is statistically significant. The tool allowed us to automatically identify verified relationships between correlated expression profiles and biological pathways using publicly available data for Saccharomyces cerevisiae. It was also used to retrieve the members of a complex (ribosome) based on the mining of expression profiles. These first results validate the relevance of the strategy and demonstrate the promising potential of BlastSets.


Figures

Figure 1
Figure 1
Examples of set definitions for biological information in yeast (genes are identified using the systematic nomenclature). (a) SWISSPROT keywords: a set contains all the sequences that are annotated with a given keyword. The sets are independent of each other and form a star graph. (b) Enzyme EC Numbers: each class in the hierarchical classification of enzymes is used to define a set. This set contains all sequences that are annotated as being part of the class plus all the sequences attached to the corresponding sub-classes. i.e.: the set of class 1.5.1 contains all the proteins in its sub-classes (sub-classes containing only one protein are not represented here). The sets are hierarchically organized and form a tree. (c) Expression profiles: each node of the binary tree resulting from a hierarchical clustering of expression profiles is used to define a set. This set contains all sequences from the corresponding branch. The sets are hierarchically organized and form a binary tree. (d) Chromosomal localization: a set is defined for each node of an implicit lattice structure built on top of the chromosomal localization of genes. All possible sets of adjacent genes are thus defined: from pairs to the complete chromosome. The sets are hierarchically organized and form a Directed Acyclic Graph (DAG).
Figure 2
Figure 2
P-value significance determination by the mean of empirical probability distribution function of the minimum P-values (a) The empirical distribution functions of the minimum P-values for two BlastSets Classifications for a query of size 50. The solid line corresponds to a hierarchical clustering of expression profiles, and the dashed line corresponds to the GeneOntology molecular function branch. For a cut-off of 0.1 and a query of size 50, the P-value threshold for significance is 8.1E−4 for the Gene Ontology whereas it is 6.2E−5 for the transcriptome experiment. (b) Estimated significant P-value threshold depending on the query set size for a cut-off of 0.1 for the Cellzome BlastSets Classification.
Figure 3
Figure 3
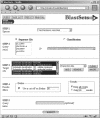
Screenshot of the web interface query tab. Step by step: (step 1) the user has selected the species S.cerevisiae, (step 2) pasted a list of four sequence identifiers (step 3) to compare to four BlastSets Classifications (step 4) with a cut-off of 0.1. This web page is publicly accessible at http://cbi.labri.fr/outils/BlastSets/.
Figure 4
Figure 4
Exploration of expression profile neighborhood using BlastSets A random sample of 20 yeast genes from the KEGG 13.1 pathway (ribosome) was used as the query set to fetch hit (significantly similar) sets among nearly 150 000 sets derived from 27 different yeast transcriptome experiments. Each gene contained in at least one hit set was assigned a score which is its number of occurrences in hit sets. The genes were sorted according to decreasing scores. The genes from the random query set are in black, the other ribosomal genes are in medium gray and genes that are not annotated as members of the ribosome are in light gray. (a) Results for gene until rank 1000; (b) Results for the genes in the first 100 ranks. n1 (YKL056C), n2 (YMR116C/ACS1), n3 (YNL119W) and n4 (YNL255C/GIS2) represent non-ribosomal genes picked out within the highest scores. R1 (RPS24B/YIL069C), R2 (RLP24/YLR009W) and R3 (RPL22B/YFL034C-A) are ribosomal genes that were present in the random query set and have a rather low score.

References

    1. Etzold T., Ulyanov,A. and Argos,P. (1996) SRS: information retrieval system for molecular biology data banks. Methods Enzymol., 266, 114–128. - PubMed
    1. Schuler G.D., Epstein,J.A., Ohkawa,H. and Kans,J.A. (1996) Entrez: molecular biology database and retrieval system. Methods Enzymol., 266, 141–162. - PubMed
    1. Tomita M., Hashimoto,K., Takahashi,K., Shimizu,T.S., Matsuzaki,Y., Miyoshi,F., Saito,K., Tanida,S., Yugi,K., Venter,J.C. et al. (1999) E-CELL: software environment for whole-cell simulation. Bioinformatics, 15, 72–84. - PubMed
    1. de Jong H., Geiselmann,J., Hernandez,C. and Page,M. (2003) Genetic Network Analyzer: qualitative simulation of genetic regulatory networks. Bioinformatics, 19, 336–344. - PubMed
    1. Danchin A. (1998) La barque de Delphes—Ce que révèle le texte des génomes. Odile Jacob, Paris, France.

Publication types