

Biophysical constraints on the origin of leaves inferred from the fossil record
- PMID: 15240879
- PMCID: PMC478576
- DOI: 10.1073/pnas.0402787101
Biophysical constraints on the origin of leaves inferred from the fossil record
Abstract
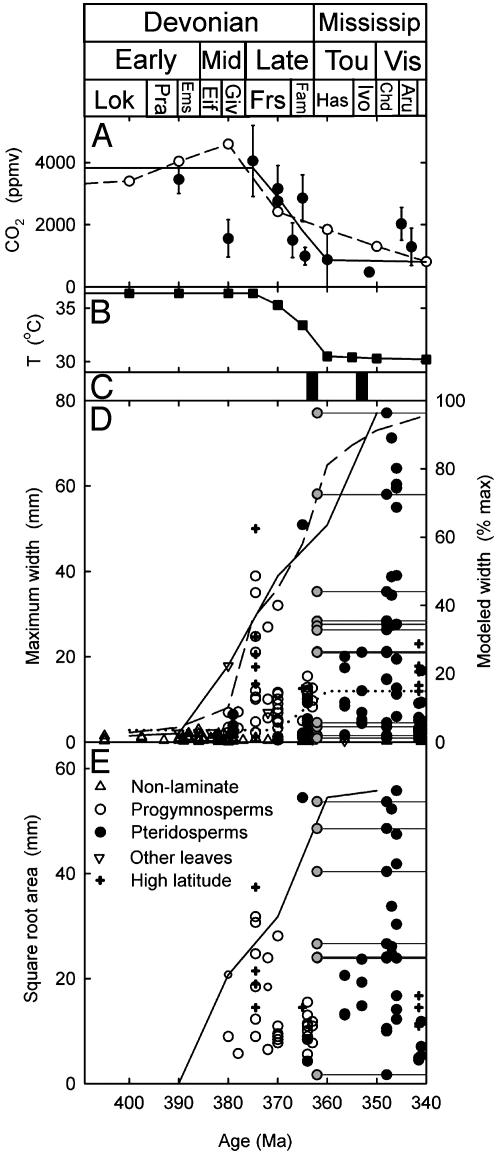
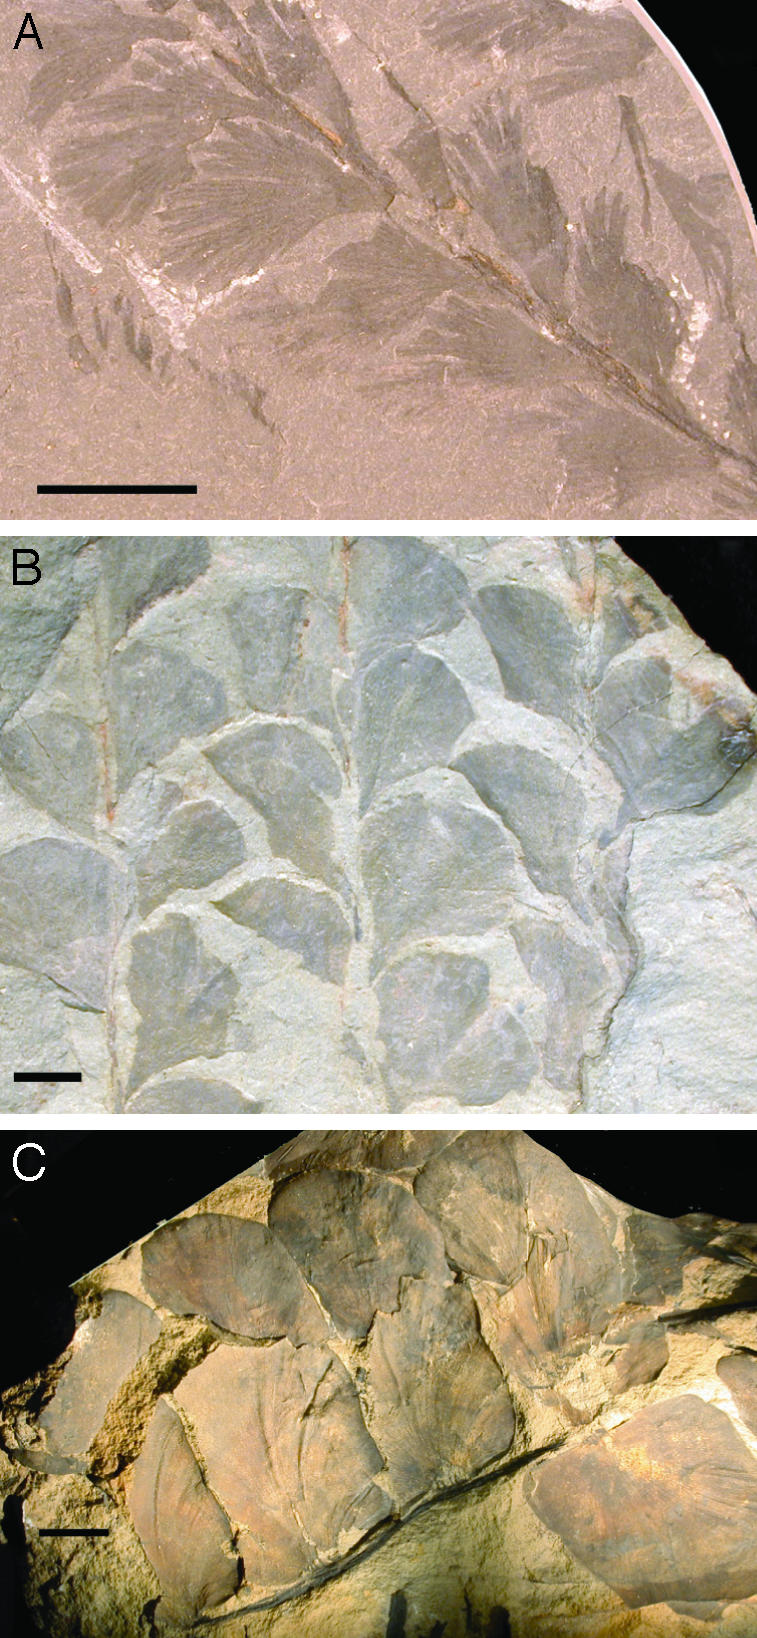
The molecular tool kit for producing flat-bladed photosynthetic structures evolved in marine and terrestrial plants during the middle Paleozoic, but it took a further 20 million years before leaves suddenly spread throughout land floras. This delay has long been difficult to explain, given the apparent advantage of leaves for photosynthetic primary production. Theory and experiments predict that exceptionally high atmospheric CO2 levels in the middle Paleozoic delayed the origin of leaves by restricting stomatal development. This would have limited evaporative cooling, leading to lethal overheating of leaves absorbing large quantities of solar energy. Here we test the central prediction of this argument with a morphometric analysis of 300 plant fossils from major European collections. We show a 25-fold enlargement of leaf blades in two phylogenetically independent clades as atmospheric CO2 levels fell during the late Paleozoic. Furthermore, preliminary data suggest that the first abrupt increase in leaf size was accompanied by an 8-fold rise in stomatal density. These evolutionary patterns support the relaxation of biophysical constraints on leaf area predicted by theory and point to a significant role for CO2 in plant evolution.
Figures
References
-
- Cronk, Q. C. B. (2001) Nat. Rev. Genet. 2, 607–619. - PubMed
-
- Zimmermann, W. (1930) Die Phylogenie der Pflanzen (Fischer, Jena, Germany).
-
- Gensel, P. G. & Andrews, H. N. (1984) Plant Life in the Devonian (Praeger Scientific, New York).
-
- Kenrick, P. & Crane, P. R. (1997) Nature 389, 33–39.
-
- Boyce, C. K. & Knoll, A. H. (2002) Paleobiology 28, 70–100.
Publication types
MeSH terms
LinkOut - more resources
Full Text Sources
