. 2004 Sep 1;559(Pt 2):459-78.
doi: 10.1113/jphysiol.2004.065706. Epub 2004 Jul 8.

A quantitative analysis of cell volume and resting potential determination and regulation in excitable cells

Affiliations

A quantitative analysis of cell volume and resting potential determination and regulation in excitable cells

James A Fraser et al. J Physiol. .

Abstract

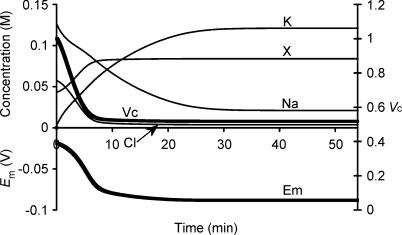
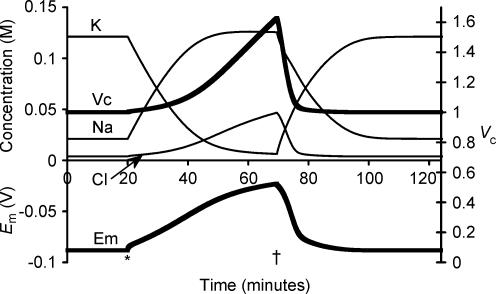
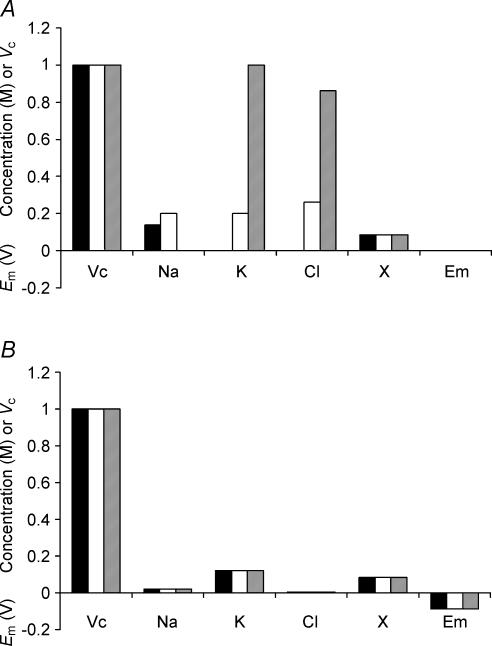
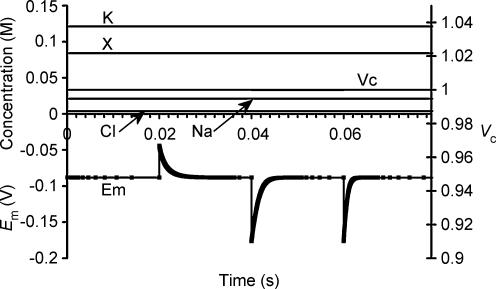
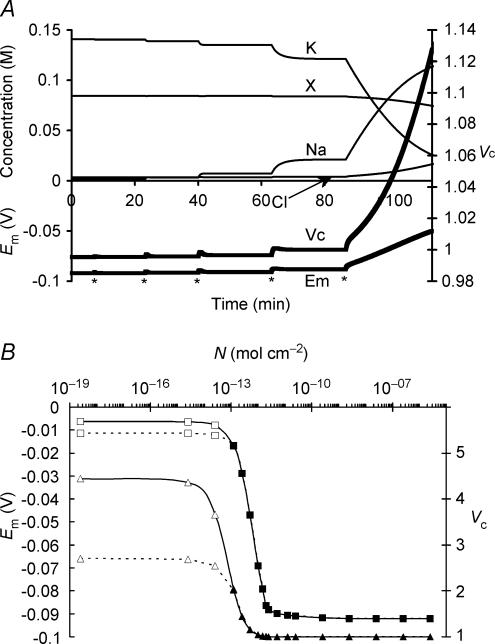
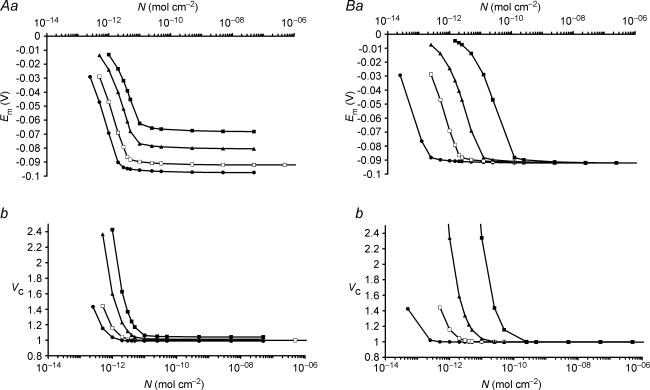
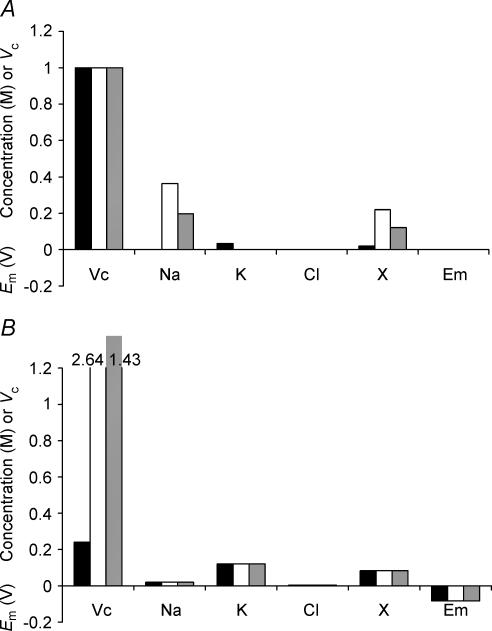
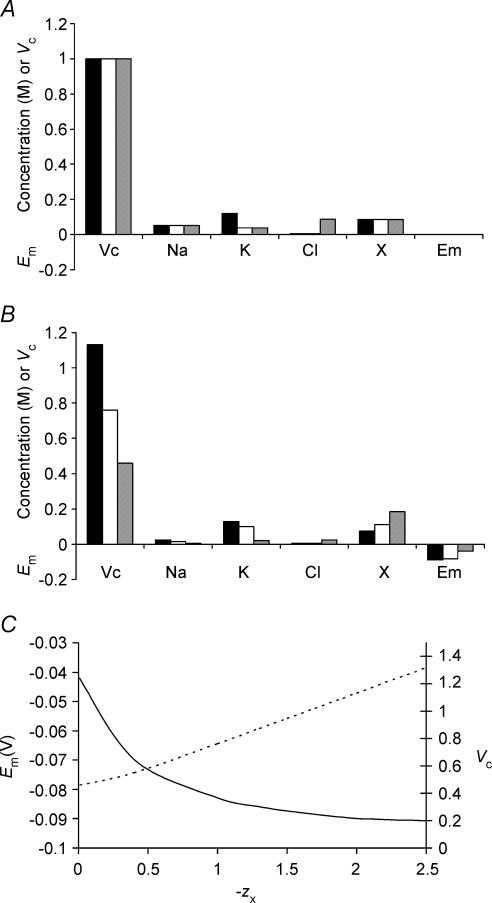
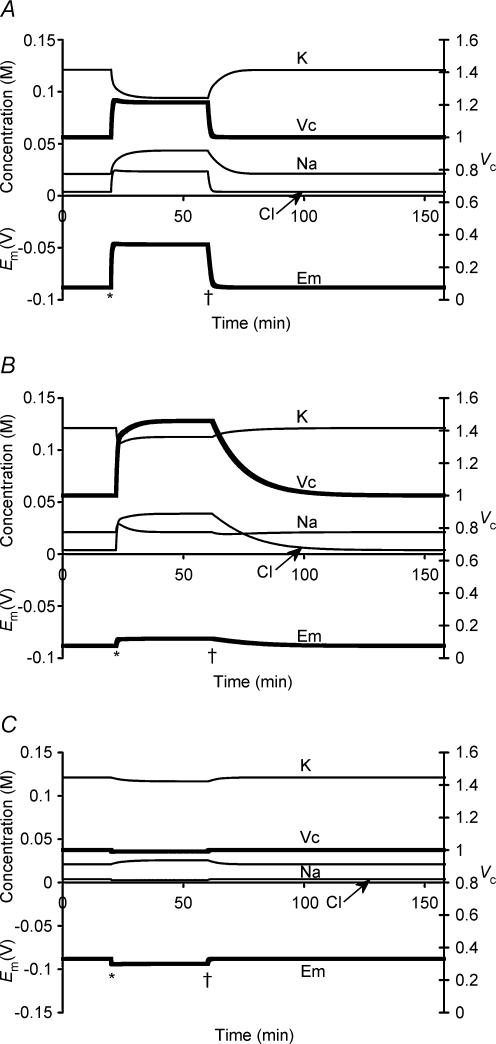
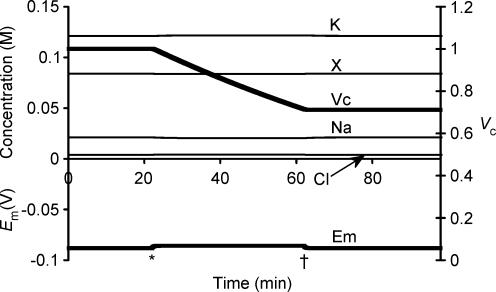
This paper quantifies recent experimental results through a general physical description of the mechanisms that might control two fundamental cellular parameters, resting potential (Em) and cell volume (Vc), thereby clarifying the complex relationships between them. Em was determined directly from a charge difference (CD) equation involving total intracellular ionic charge and membrane capacitance (Cm). This avoided the equilibrium condition dEm/dt = 0 required in determinations of Em by previous work based on the Goldman-Hodgkin-Katz equation and its derivatives and thus permitted precise calculation of Em even under non-equilibrium conditions. It could accurately model the influence upon Em of changes in Cm or Vc and of membrane transport processes such as the Na+-K+-ATPase and ion cotransport. Given a stable and adequate membrane Na+-K+-ATPase density (N), Vc and Em both converged to unique steady-state values even from sharply divergent initial intracellular ionic concentrations. For any constant set of transmembrane ion permeabilities, this set point of Vc was then determined by the intracellular membrane-impermeant solute content (X-i) and its mean charge valency (zX), while in contrast, the set point of Em was determined solely by zX. Independent changes in membrane Na+ (PNa) or K+ permeabilities (PK) or activation of cation-chloride cotransporters could perturb Vc and Em but subsequent reversal of such changes permitted full recovery of both Vc and Em to the original set points. Proportionate changes in PNa, PK and N, or changes in Cl- permeability (PCl) instead conserved steady-state Vc and Em but altered their rates of relaxation following any discrete perturbation. PCl additionally determined the relative effect of cotransporter activity on Vc and Em, in agreement with recent experimental results. In contrast, changes in Xi- produced by introduction of a finite permeability term to X- (PX) that did not alter zX caused sustained changes in Vc that were independent of Em and that persisted when PX returned to zero. Where such fluxes also altered the effective zX they additionally altered the steady state Em. This offers a basis for the suggested roles of amino acid fluxes in long-term volume regulatory processes in a variety of excitable tissues.


Figures

Figure 1
Figure 1. Activation of the sodium pump in a cell initially close to passive equilibrium
The model was initiated with values of all intracellular ionic concentrations close to equilibrium with the extracellular fluid, although with approximately half the normal organic anion concentration and a consequently lower [Cl]i to maintain a total intracellular charge difference of zero. Thus initially [Na+]i = 126.7 mm, [K+]i = 2.5 mm, [Cl]i = 57.5 mm and [X]i = 43.5 mm. Vc was initially defined as 1. Symbols are as follows: K: [K+]i; Na: [Na+]i; Cl: [Cl]i; X: [X]i; Em: Em, Vc: Vc. The basic parameters such as ion permeabilities and sodium pump density were derived from frog skeletal muscle (Table 1). Note that despite the arbitrary starting conditions, each intracellular ion concentration, Vc and Em all reach stable values that are strikingly similar to normal values for frog skeletal muscle.
Figure 2
Figure 2. The effect of sodium pump inhibition
The model was initiated with variables derived from the final results shown in Fig. 1, and therefore all variables were initially stable. For clarity, [X]i is not shown, as it is membrane impermeant, and thus its concentration is straightforwardly related to Vc. At the point marked *, sodium pump density was reduced to zero, to simulate total sodium pump inhibition. Note the rapid small upward step in Em that resulted from the loss of the electrogenic pump activity. Following this there was a gradual slower depolarization as [K+]i and [Na+]i began to equilibrate with the extracellular fluid. This depolarization allowed [Cl] influx and thus volume increase. At the point marked †, sodium pump density was returned to its original value. Note that Vc, Em and all intracellular ion concentrations returned to their starting values.
Figure 3
Figure 3. Initial intracellular inorganic ion concentrations do not influence eventual stable values of Vc or Em
A, the starting conditions of three cells used as examples. The model was initiated with the intracellular organic anion concentration identical to that eventually reached in Fig. 1, but with three arbitrary and sharply different intracellular inorganic ion concentrations. Note that none of the cells were initially isotonic to the extracellular fluid. B, the final stable values reached after a 5-h modelling period. Variation in the initial intracellular inorganic ion concentrations has no influence on final stable values of Vc, Em, [Na+]i, [K+]i, [Cl]i or [X]i.
Figure 4
Figure 4. Membrane capacitance does not influence stable values of Vc or Em
The model was initiated with variables derived from the final results shown in Fig. 1, and therefore all variables were initially stable. At 0.02 s, the membrane capacitance (Cm) was doubled from 7 μF cm−2 to 14 μF cm−2. This caused an immediate halving of Em, but Em then relaxed towards its original value extremely rapidly (half-time 0.001 s). Although this reflected a submicromolar change in the charge difference, the ion concentrations and Vc were grossly unchanged. At 0.04 s, Cm was returned to 7 μF cm−2, resulting in a reverse of the original step change in Em and a similar relaxation toward resting values (half time 0.001 s). Finally at 0.06 s Cm was halved to 3.5 μF cm−2, resulting in an immediate doubling of Em, followed by its rapid relaxation towards the original steady state value (half-time 0.0005 s). Note the rapid time scale: Em recovery to its steady state value following Cm changes occurs so rapidly that slow changes in Cm do not cause detectable Em changes.
Figure 5
Figure 5. Sodium pump activity is required for volume stability, but within limits, variations in its activity leave Vc and Em conserved
A, the effect of successive 10-fold reductions (each marked *) in sodium pump density (N) from an initial value of 5 × 10⁻⁸ mol cm−2. Notice that at values of N sufficient to allow stable cell volume, large changes in N had relatively little effect on Vc or Em, such that a 10 000-fold reduction to N = 5 × 10⁻¹² mol cm−2 resulted in <1% increase in Vc and < 5% depolarization of Em. However, a further 10-fold reduction in N destabilized cell volume. B, a summary of the relationship between N, Vc (triangles) and Em (squares). Filled symbols denote final stable values, while for values of N insufficient to stabilize cell volume, the open symbols denote values of Em or Vc obtained either 50 min (dashed line) or 150 min (continuous line) after N was reduced from 5 × 10⁻¹² mol cm−2 to the value indicated. Note that, for this particular set of ion permeabilities, a pump density of at least 2.5 × 10⁻¹³ mol cm−2 was necessary for stability of Vc or Em. Note that for all values of N sufficient to result in Em of at least −80 mV (N > 3 × 10⁻¹² mol cm−2), variation in N has little influence on Vc or Em. Thus for an excitable cell at least, variation of sodium pump density could not be expected to regulate or determine Vc or Em.
Figure 6
Figure 6. The influence of sodium and potassium permeabilities on Vc and Em
In each figure, open symbols mark the line showing the relationship between N and Vc or Em for the case of PNa: PK = 0.02: 1, the permeability ratio explored in detail in Fig. 5. For clarity, only N-values that result in stable values of Em and Vc are plotted in this figure. A, at constant PK, the relationship between N and (a) Em or (b) Vc for four different PK: PNa ratios. PNa: PK ratios: • 0.01: 1; □ 0.02: 1; ▴ 0.05: 1; ▪ 0.1: 1. B, at constant PK/PNa, the relationship between N and (a) Em or (b) Vc for four different values of PK. PNa: PK ratios: • 0.002: 0.1; □ 0.02: 1; ▴ 0.1: 5; ▪; 1: 50. Note that increases in PK without alteration of the PNa: PK ratio resulted in a rightward shift of the Em or Vc against N plots of equal magnitude, such that variation in PK with a constant PNa: PK: N ratio did not change Em or Vc set point. In contrast, an increase of the PNa: PK ratio at constant PK resulted primarily in an upward shift of the Em or Vc against N curves. PCl did not influence the steady state values of any of the modelled variables (not shown).
Figure 7
Figure 7. Intracellular organic ion concentration determines the eventual stable value of Vc but does not influence Em
A, the starting conditions of three cells. These cells were modelled with initially different intracellular organic anion concentrations. Note that although initial intracellular inorganic ion concentrations also varied between the three cells, this would have no influence on the final stable values of Vc or Em (see Fig. 3). B, the final stable values reached after a 5-h modelling period. Each cell reached identical stable values of Em, [Na+]i, [K+]i, [Cl]i or [X]i, demonstrating that variation of intracellular organic anion content has no influence on these variables. In contrast, the final stable volumes were sharply different.
Figure 8
Figure 8. The mean valency of intracellular organic osmolyte influences the eventual stable values of both Vc and Em
A, the starting conditions of three cells. These cells were modelled with initially identical intracellular organic osmolyte concentrations, but in each cell the mean charge valency of this osmolyte (zX) was different. Note that although initial intracellular inorganic ion concentrations also varied between the three cells, this would have no influence on the final stable values of Vc or Em (see Fig. 3). Filled columns: zX = 2; open columns, zX = 1; grey columns, zX = 0. B, the final stable values reached after a 5- h modelling period. Each cell reached stable values of Vc, Em, [Na+]i, [K+]i, [Cl]i or [X]i, but there were no similarities between the three cells. Increasing the negative charge on intracellular organic osmolyte produced larger, more highly polarized cells. C, a summary of the influence of zX upon Em (continuous line) and Vc (dashed line).
Figure 9
Figure 9. The effects of cation–chloride cotransport activity
NKCC activity in a tissue with PCl/PK = 3 (similar to that of skeletal muscle) (A) and PCl/PK = 0.05 (similar to that of an erythrocyte) (B). All other parameters were identical, and both cells were subjected to the same levels of NKCC activity. Thus in each case PNKCC was initially 0, was stepped to 10 000 after 20 min (marked *), and was then returned to 0 at 60 min (marked †). Note that in each case, the NKCC caused a rapid increase in [Na+]i and [Cl]i, and a paradoxical reduction in [K+]i despite an increase in cellular K+ content, due to the concomitant water influx. In addition, both cells reached new stable values of Vc, Em and all intracellular solute concentrations despite the continued ion influx through the NKCC. This was due to a reduction in NKCC activity as the [Na+]i[K+]i[Cl]i2 product increased, and an increase in Na+–K+-ATPase activity as the [Na+]i increased, [K+]i decreased and Em depolarized. However, in the cell depicted in panel A, Em depolarized very significantly (>50% reduction) while Vc increased by approximately 20%. In contrast, the cell depicted in panel B showed very significant swelling (>40%) and very little depolarization of Em (<10%). The rate of recovery to normal values of Em and Vc following cessation of NKCC activity is also significantly different between the two cells. C, corresponding effects of KCC activity in a high PCl cell. Although efflux of K+ and Cl was initially favourable, the efflux was severely limited by the low [Cl]i in such a highly polarized cell. Vc therefore decreased by <1%, while Em hyperpolarized by 5 mV. Note the small increase in [Na+]i and decrease in [K+]i due to the effect of this hyperpolarization upon the Na+–K+-ATPase.
Figure 10
Figure 10. Organic osmolyte efflux
Organic osmolyte efflux was simulated by introducing a small membrane permeability to organic anions, PX = 0.0001, at the point marked *, allowing gradual outward diffusion of X. Such efflux drove steady water efflux and volume reduction. It also caused a small depolarization from −89 mV to −86 mV, as would be expected from the introduction of a permeability term for an otherwise internally sequestered anion. In contrast to the effect of a similar period of cation–chloride cotransport (Fig. 9), the volume change was able to continue almost indefinitely without any further alteration to the membrane potential. Most strikingly, the cessation of organic osmolyte efflux (at the point marked †) showed that the volume reduction was not reversed by continued activity of the sodium pump, in sharp contrast to volume changes resulting from inorganic ion fluxes.

Similar articles

Cited by

References

    1. Adrian RH. The effect of internal and external potassium concentration on the membrane potential of frog muscle. J Physiol. 1956;133:631–658. - PMC - PubMed
    1. Aickin CC, Betz WJ, Harris GL. Intracellular chloride and the mechanism for its accumulation in rat lumbrical muscle. J Physiol. 1989;411:437–455. - PMC - PubMed
    1. Armstrong CM. The Na/K pump, Cl ion, and osmotic stabilization of cells. Proc Natl Acad Sci U S A. 2003;100:6257–6262. - PMC - PubMed
    1. Baumgarten CM, Clemo HF. Swelling-activated chloride channels in cardiac physiology and pathophysiology. Prog Biophys Mol Biol. 2003;82:25–42. - PubMed
    1. Blinks JR. Influence of osmotic strength on cross-section and volume of isolated single muscle fibres. J Physiol. 1965;177:42–57. - PMC - PubMed

Publication types

MeSH terms

LinkOut - more resources