Comparative Study
. 2004 Sep 1;559(Pt 2):479-96.
doi: 10.1113/jphysiol.2004.068213. Epub 2004 Jul 8.

Mechanism of spontaneous excitability in human embryonic stem cell derived cardiomyocytes

Affiliations
Comparative Study

Mechanism of spontaneous excitability in human embryonic stem cell derived cardiomyocytes

Jonathan Satin et al. J Physiol. .

Abstract

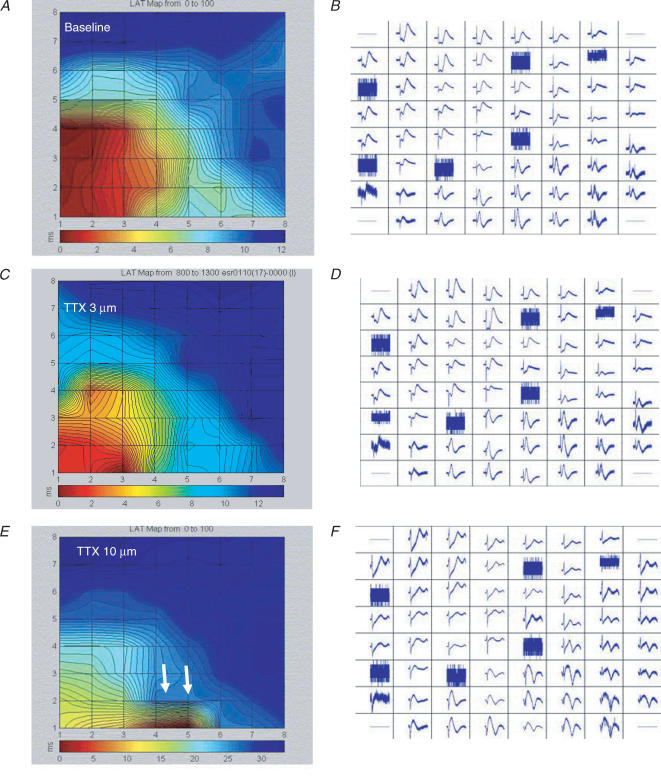
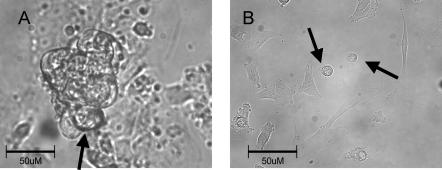
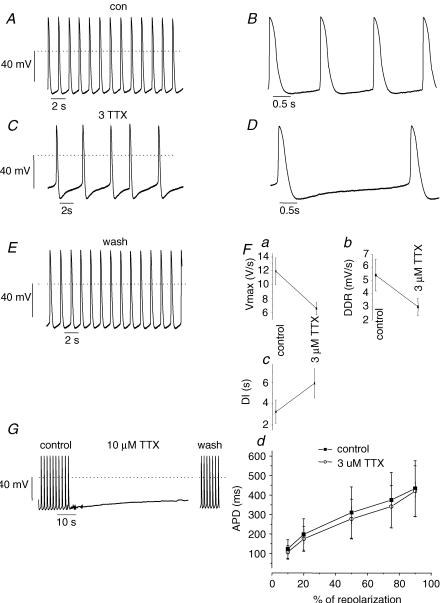
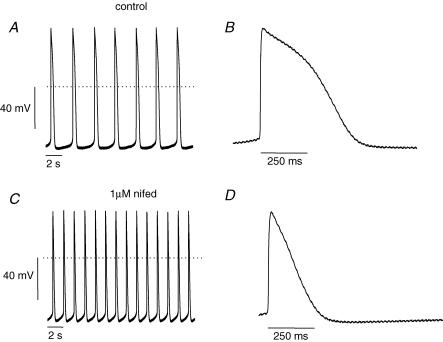
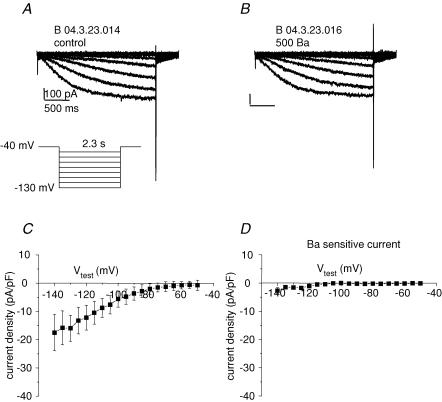
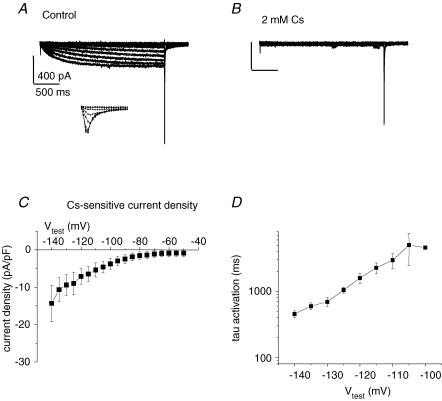
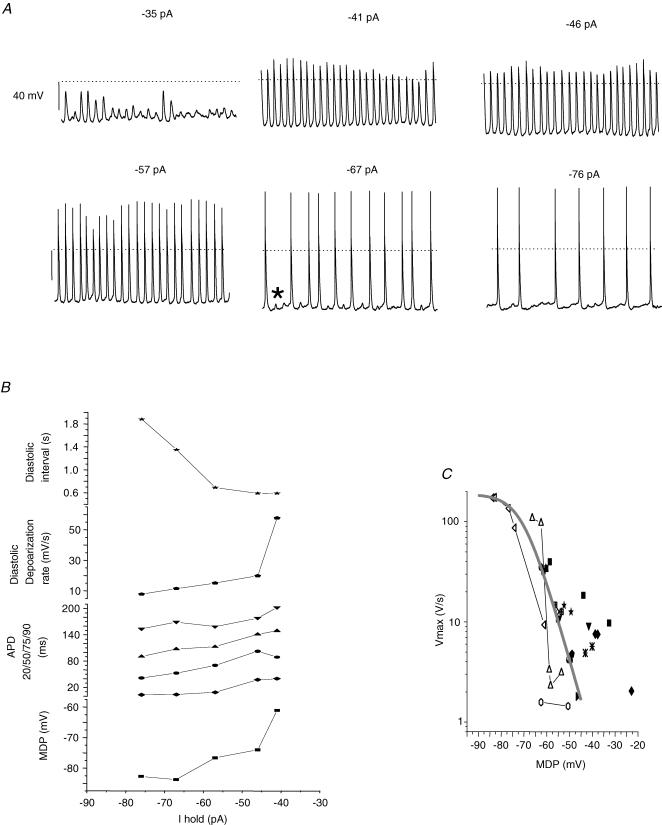
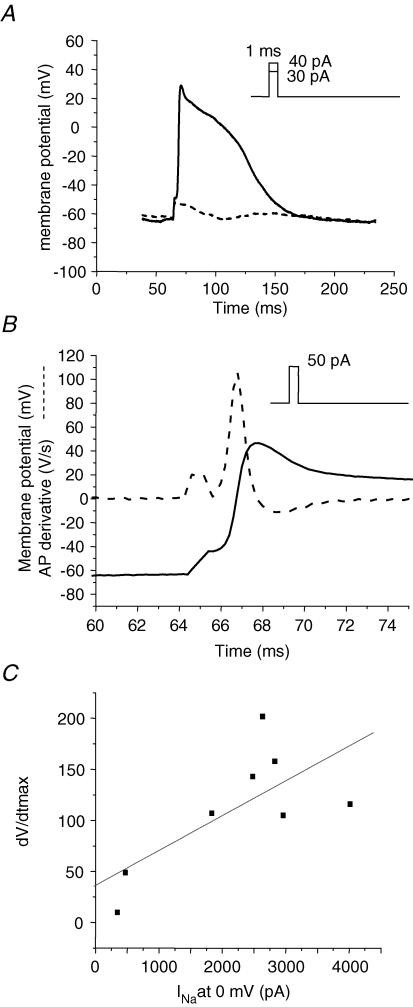
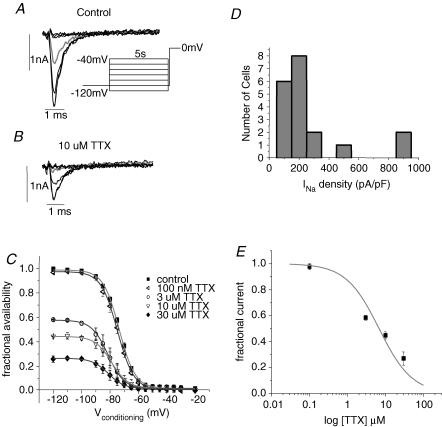
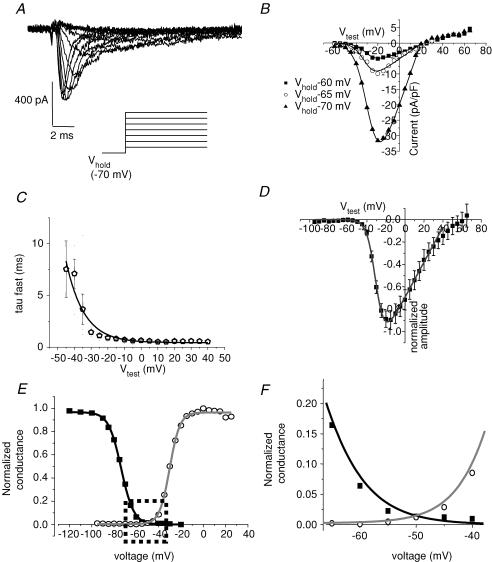
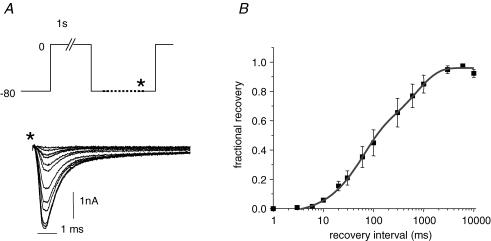
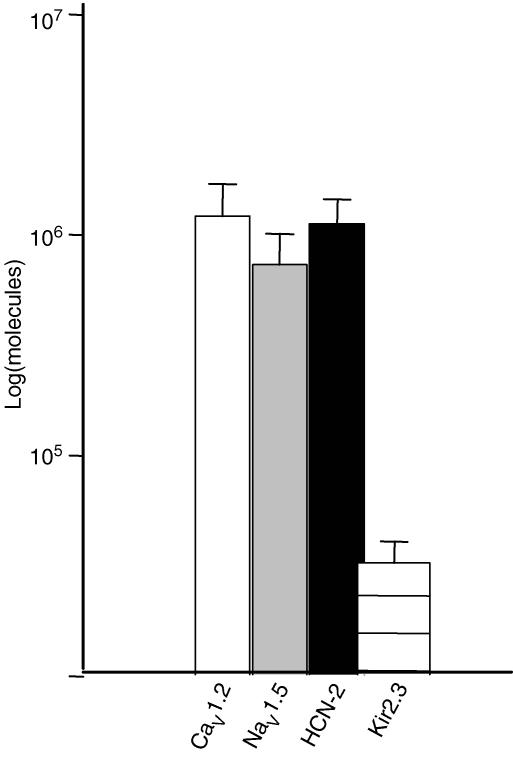
Human embryonic stem cell-derived cardiomyocytes (hES-CMs) are thought to recapitulate the embryonic development of heart cells. Given the exciting potential of hES-CMs as replacement tissue in diseased hearts, we investigated the pharmacological sensitivity and ionic current of mid-stage hES-CMs (20-35 days post plating). A high-resolution microelectrode array was used to assess conduction in multicellular preparations of hES-CMs in spontaneously contracting embryoid bodies (EBs). TTX (10 microm) dramatically slowed conduction velocity from 5.1 to 3.2 cm s(-1) while 100 microm TTX caused complete cessation of spontaneous electrical activity in all EBs studied. In contrast, the Ca2+channel blockers nifedipine or diltiazem (1 microm) had a negligible effect on conduction. These results suggested a prominent Na+ channel current, and therefore we patch-clamped isolated cells to record Na+ current and action potentials (APs). We found for isolated hES-CMs a prominent Na+ current (244 +/- 42 pA pF(-1) at 0 mV; n=19), and a hyperpolarization-activated current (HCN), but no inward rectifier K+ current. In cell clusters, 3 microm TTX induced longer AP interpulse intervals and 10 microm TTX caused cessation of spontaneous APs. In contrast nifedipine (Ca2+ channel block) and 2 mm Cs+ (HCN complete block) induced shorter AP interpulse intervals. In single cells, APs stimulated by current pulses had a maximum upstroke velocity (dV/dtmax) of 118 +/- 14 V s(-1) in control conditions; in contrast, partial block of Na+ current significantly reduced stimulated dV/dtmax (38 +/- 15 V s(-1)). RT-PCR revealed NaV1.5, CaV1.2, and HCN-2 expression but we could not detect Kir2.1. We conclude that hES-CMs at mid-range development express prominent Na+ current. The absence of background K+ current creates conditions for spontaneous activity that is sensitive to TTX in the same range of partial block of NaV1.5; thus, the NaV1.5 Na+ channel is important for initiating spontaneous excitability in hES-derived heart cells.


Figures

Figure 1
Figure 1. MEA – Na+ channel block, but not Ca2+ channel block slows conductionb
A and B, simultaneous extracellular tracings from all 60 electrodes (B) recorded from a beating EB and the resulting high-resolution activation map (A) as generated by the MEA mapping technique, during baseline recordings. CF, extracellular recordings (D,F) and activation maps (C,E) generated from the same EB following application of 3 μm (C,D) and 10 μm (E,F) TTX. Note the increase in total MEA activation time from a baseline value of 11.5 ms to 14.0 ms (C) to 35.0 ms (E). In some of the EBs application of TTX (10 μm) also resulted in the generation of local conduction blocks (white arrows).
Figure 2
Figure 2. Representative beating cell clusters and isolated cells
A shows all the cells within the cluster contracting in synchrony suggesting entrainment of cells electrical activity. Note the typical pattern of growth that includes cells growing vertically. Arrow shows a common approach angle for patch electrode to a cell on the periphery of the beating cluster. B, single cells chosen for study, indicated by arrows, beat spontaneously and were roughly spherical with a slightly splayed, flat attachment to the coverslip. Both photographs acquired with 40× objective lens.
Figure 3
Figure 3. Action potentials from cell clusters are sensitive to TTX
A and B, APs from a representative cluster in control bath solution. Note that the AP rhythm was regular. B, expanded view of A to illustrate AP morphology. Dotted line indicates 0 mV. C and D, 3 μm TTX slowed spontaneous rate of AP initiation. D, expanded view of C; in comparison to control (A) the major effect of 3 mm TTX was to slow the spontaneous diastolic depolarization. E, washout of TTX shows the effects are reversible. F, summary data from 6 recordings shows that 3 μm TTX: (a) slowed the maximum upstroke velocity (Vmax), (b) slowed the diastolic depolarization rate (DDR), and (c) prolonged the diastolic interval. All the effects were statistically significant (P < 0.01). Fd, APD is plotted as a function of the time required for 10, 20, 50, 75 and 90% of repolarization. Control APD (▪) tended to be shorter than APD in the presence of TTX (○), but the differences were not significant. n = 6 for all panels. G, APs from a representative cluster in control, 10 μm TTX and following washout. 10 μm TTX induced quiescence and was accompanied by a slow steady depolarization to ∼−40 mV. Note break in time scale due to relative prolonged washout duration.
Figure 4
Figure 4. Nifedipine does not inhibit spontaneous APs
A and B, representative recordings of spontaneous APs from a cell cluster in control bath solution. C and D, 1 μm nifedipine increases spontaneous AP rate. B and D show traces on an expanded time scale to highlight effects of nifedipine. Although 1 μm nifedipine did not block spontaneous AP activity it dramatically shortened APD as expected from Ca2+ channel blockade.
Figure 5
Figure 5. No Kir current is detectable
A, representative single cell, whole-cell patch-clamp recording of current elicited by protocol depicted in the inset in control bath solution. Vhold = −40 mV, Vtest for 2.3 s duration to potentials ranging from −50 to −140 mV in 5 mV increments (for clarity currents for 10 mV increments are shown). Inward current is apparent for potentials negative to ∼60 mV. B, same protocol as A in response to 0.5 mm Ba2+. C, current–voltage plot for 2.3 s isochronal current in control solution; n = 6. D, 0.5 mm Ba2+-sensitive 2.3 s isochronal current–voltage relationship. Note the absence of detectable inward rectifier current.
Figure 6
Figure 6. HCN current in hES-CMs
A, representative single cell, whole-cell patch-clamp recording of current elicited by protocol depicted in Fig. 5. Note as in Fig. 5 the slowly developing hyperpolarization-activated current. Also, on the return voltage step to +40 mV a large inward current is activated for Vtest > −70 mV. Inset, expanded time scale of the return step to −40 mV showing inward current. The inward current amplitude upon return to −40 mV is a function of the preceding membrane potential value. The largest inward current amplitude was measured following a −130 mV pulse, while following the −70 mV pulse the current amplitude was approximately half-maximal. B, 2 mm Cs+ induced complete block of slowly developing hyperpolarization-activated current. Note the lack of effect on the rapid inward current activated by the return voltage step to −40 mV C, current–voltage plot for 2.3 s isochronal Cs+−sensitive current. D, time course of activation was fitted to a single exponential function; shown is the time constant of activation as a function of Vtest.
Figure 7
Figure 7. Spontaneous AP generation corresponds to a window of voltages that corresponds to the overlap of Na+ channel activation and inactivation
A, representative single cell APs recorded from the whole-cell configuration. The amplitude of constant holding current is listed above each subpanel. Dotted line is 0 mV; scale bar 40 mV 15 s of continuous data shown for each panel. Asterisk in bottom centre panel shows typical ‘failed’ AP initiation. B, AP parameters plotted as a function of holding current for cell shown in A. C, pooled data from 3 single cells and 14 cell cluster recordings. Individual symbol types depict separate recordings. Vmax is plotted as a function of MDP. The smooth grey line is a Boltzmann distribution with a midpoint of −72.5 mV, a slope of 5.4 and a maximum of 118.
Figure 8
Figure 8. Single cell APs are stimulated with small, brief current pulses
A, representative AP elicited by a 1 ms duration, 40 pA current injection (continuous line) superimposed on the Vm response to a subthreshold stimulus (dashed line). Constant holding current maintained MDP ∼−65 mV (29 pA in this example). B, a supra-threshold stimulus (50 pA) elicits an AP upstroke (continuous line) with a rapid Vmax. Dashed line superimposed on AP is the AP derivative to illustrate dV/dtmax (Vmax). Note the expanded time scale relative to A to illustrate rate of rise of AP. C, a subset of 9 cells in which Na+ current was recorded following single cell APs. Vmax is plotted as a function of Na+ current. Linear regression (R) = 0.71.
Figure 9
Figure 9. Steady-state inactivation and TTX blockade of hES-CM INaare similar to that for cardiac Na+ channels
A, current traces elicited by a test potential step to 0 mV following 5 s conditioning steps to −120, −100, −80, −70, −60, −50 and −40 mV under control ionic conditions. Grey current trace is for conditioning voltage step to −70 mV. B, same voltage protocol and same current traces shown as in A, but in the presence of 3 μm TTX. Grey trace is also the current elicited following a conditioning step to −70 mV. C, normalized steady-state inactivation curve in control bath and for TTX concentrations as indicated; n = 12. Smooth line is Boltzmann distribution with the following values for half-activation (V½) and slope factors (k): control (▪), −73 mV and 5.6; 0.1 μm TTX (◃), −74 mV and 5.8; 3 μm TTX (○), −81 mV and 5.8; 10 μm TTX (▽), −79 mV and 5.8; 30 μm TTX (♦), −81 mV and 5.7. D, distribution of current density of cells from peak current obtained from the steady-state inactivation protocol. Bin width is 100 pA pF−1. E, TTX dose–response relationship fitted with a single site blocking curve of the form: fractional block = 1/(1 + [TTX]/Kd) with Kd = 6.8 μm.
Figure 10
Figure 10. INa in response to increasing depolarizations
A, current traces elicited from Vhold −70 mV to depolarizations ranging from −60 to −5 mV in 5 mV increments in a representative cell. B, current–voltage relationship for peak inward current of a representative cell for Vhold −60 (▪), −65 (○), and −70 mV (▴). Smooth curve is a modified Boltzmann distribution where, G(V) = Gmax(VtestErev))/{1 + exp((V½Vtest)/k}, with half-activation (V½) and slope factors (k) of −30 mV and 5.2 for Vhold = −60 mV; −31 mV and 5.1 for Vhold = −65 mV; −29 mV and 5.9 for Vhold = −70 mV. C, macroscopic current decay was fitted to a bi-exponential function. τfast is plotted as a function of test potential (Vtest). Curve is a single exponential fit of τfast with a maximum rate of 0.4 ms. D, normalized pooled data for peak inward current elicited by various test potentials. Smooth curve is a modified Boltzmann distribution with V½ = −30 mV, k = 4.6, and Erev = 44 mV; n = 21. E, conductance transform of D (activation curve, grey line) superimposed on the normalized peak steady-state inactivation curve from Fig. 9C. Dashed box indicates approximate boundaries of the potential range for diastolic depolarization. F, expanded view of the dashed box in E to illustrate the overlapping window of potentials where Na+ channels may simultaneously activate and are partially available to activate.
Figure 11
Figure 11. Time course of recovery from inactivation of INa
A, schematic diagram of protocol used to assess recovery from inactivation. Cell was returned to −80 mV for a variable duration following a 1 s depolarization to 0 mV. Data acquisition was initiated as indicated by asterisk. Representative current traces elicited by final test step to 0 mV for recovery intervals listed in the graph in B. Scale bars 1 ms and 1 nA. B, pooled, normalized recovery from inactivation data is fitted by a bi-exponential function with time constants of 57 ms (55% of the amplitude) and 457 ms (45% of the amplitude). Peak current was normalized to current recovery following a 10 s interpulse interval.
Figure 12
Figure 12. RT-PCR analysis of hES expression of ion channel mRNA
We detected similar expression of RNA encoding NaV1.5, CaV1.2, and HCN2. A much weaker signal for Kir2.3 was observed. In contrast, we could not detect CaV1.3, Kir2.1 or HCN-4. Primer sequences and accession numbers are listed in Table 1.

Similar articles

Cited by

References

    1. Amit M, Carpenter MK, Inokuma MS, Chiu CP, Harris CP, Waknitz MA, Itskovitz-Eldor J, Thomson JA. Clonally derived human embryonic stem cell lines maintain pluripotency and proliferative potential for prolonged periods of culture. Dev Biol. 2000;227:271–278. - PubMed
    1. Bustin SA. Quantification of mRNA using real-time reverse transcription PCR (RT-PCR): trends and problems. J Mol Endocrinol. 2002;29:23–39. - PubMed
    1. Carmeliet E. Voltage-dependent block by tetrodotoxin of the sodium channel in rabbit cardiac Purkinje fibers. Biophys J. 1987;51:109–114. - PMC - PubMed
    1. Cohen CJ, Bean BP, Tsien RW. Maximal upstroke velocity as an index of available sodium conductance. Comparison of maximal voltage clamp measurements of sodium current in rabbit Purkinje fibers. Circulation Res. 1984;54:636–651. - PubMed
    1. Davies MP, An RH, Doevendans P, Kubalak S, Chien KR, Kass RS. Developmental changes in ionic channel activity in the embryonic murine heart. Circ Res. 1996;78:15–25. - PubMed

Publication types