Review
. 2004 Apr-Jun;5(2):96-117.

Cancer burden and trends in the Asian Pacific Rim region

Affiliations
Review

Cancer burden and trends in the Asian Pacific Rim region

Binh H Yang et al. Asian Pac J Cancer Prev. 2004 Apr-Jun.

Abstract

This paper describes the current cancer burden and time trends, discusses dominant risk factors and prevention and control strategies, and makes future projections for the top eight cancers (stomach, lung, liver, colon/rectum, esophagus, breast, cervix, and leukemia) in the Asian Pacific Rim region. The future cancer trends through to the year 2050 are projected based on population dynamics, including population growth and ageing. In 2000, the Asian Pacific Rim had over 3 million new cancer cases, over 2 million cancer deaths, and 5.4 million people living with cancer. In 2050, 7.8 million new cancer cases and 5.7 million deaths from cancer are projected. The current cancer burden and the future projection provide facts that cancer is and will be a very serious public health problem in the Asian Pacific Rim region and will assist public health officers and cancer researchers in the design and establishment of public health policies, prioritization of future research, and application of current knowledge in the prevention and control of cancer.


Figures

Figure 1
Figure 1
Number of New Cases (in thousands) for the 10 most Common Cancers, 2000
Figure 2
Figure 2
Number of Deaths (in thousands) for the 10 most Common Cancers, 2000
Figure 3
Figure 3
Five-year Prevalence (in thousands) for the 10 most Prevalent Cancers, 2000
Figure 4
Figure 4
Age-standardized Incidence Rates (per 100,000) for All Cancer Sites by Pacific Rim Region, 2000
Figure 5
Figure 5
Age-standardized Mortality Rates (per 100,000) for All Cancer Sites by Pacific Rim Region, 2000
Figure 6
Figure 6
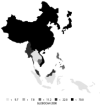
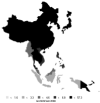
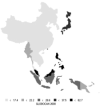
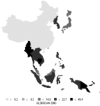
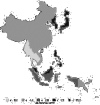
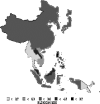
Incidence of Stomach Cancer: Age-standardized Rates (per 100,000) - Males (all ages)
Figure 7
Figure 7
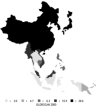
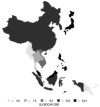
Incidence of Stomach Cancer: Age-standardized Rates (per 100,000) - Females (all ages)
Figure 8
Figure 8
Stomach Cancer Incidence Trends by Sex
Figure 9
Figure 9
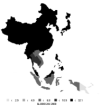
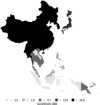
Incidence of Lung Cancer: Age-standardized Rates (per 100,000) - Males (all ages)
Figure 10
Figure 10
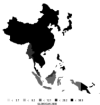
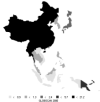
Incidence of Lung Cancer: Age-standardized Rates (per 100,000) - Females (all ages)
Figure 11
Figure 11
Lung Cancer Incidence Trends by Sex
Figure 12
Figure 12
Incidence of Liver Cancer: Age-standardized Rates (per 100,000) - Males (all ages)
Figure 13
Figure 13
Incidence of Liver Cancer: Age-standardized Rates (per 100,000) - Females (all ages)
Figure 14
Figure 14
Liver Cancer Incidence Trends by Sex
Figure 15
Figure 15
Incidence of Colorectal Cancer: Age-standardized Rates (per 100,000) - Males (all ages)
Figure 16
Figure 16
Incidence of Colorectal Cancer: Age-standardized Rates (per 100,000) - Females (all ages)
Figure 17
Figure 17
Colorectal Cancer Incidence Trends by Sex
Figure 18
Figure 18
Incidence of Esophageal Cancer: Age-standardized Rates (Pacific Rim, per 100,000) - Males (all ages)
Figure 19
Figure 19
Incidence of Esophageal Cancer: Age-standardized Rates (Pacific Rim, per 100,000) - Females (all ages)
Figure 20
Figure 20
Esophageal Cancer Incidence Trends by Sex
Figure 21
Figure 21
Incidence of Breast Cancer: Age-standardized Rates (Pacific Rim, per 100,000) - Females (all ages)
Figure 22
Figure 22
Female Breast Cancer Incidence Trends
Figure 23
Figure 23
Incidence of Cervical Cancer: Age-standardized Rates (Pacific Rim, per 100,000) - Females (all ages)
Figure 24
Figure 24
Cervical Cancer Incidence Trends
Figure 25
Figure 25
Incidence of Leukemia: Age-standardized Rates (Pacific Rim, per 100,000) - Males (all ages)
Figure 26
Figure 26
Incidence of Leukemia: Age-standardized Rates (Pacific Rim, per 100,000) - Females (all ages)
Figure 27
Figure 27
Leukemia Incidence Trends by Sex
Figure 28
Figure 28
Projected Population Pyramids of the Pacific Rim in 2000, 2010, 2020 and 2050

Comment in

Similar articles

Cited by

References

    1. Aguilar F, Hussain SP, Cerutti P. Aflatoxin B1 induces the transversion of G-->T in codon 249 of the p53 tumor suppressor gene in human hepatocytes. Proc Natl Acad Sci U S A. 1993;90:8586–90. - PMC - PubMed
    1. Alberts DS, Martinez ME, Roe DJ, et al. Lack of effect of a high-fiber cereal supplement on the recurrence of colorectal adenomas. Phoenix Colon Cancer Prevention Physicians' Network. N Engl J Med. 2000;342:1156–62. - PubMed
    1. American Cancer Society . Cancer Facts & Figures 2002. American Cancer Society, Inc.; Atlanta, GA.: 2002.
    1. Armitage P, Doll R. The age distribution of cancer and a multi-stage theory of carcinogenesis. Br J Cancer. 1954;8:1–12. - PMC - PubMed
    1. Beasley RP, Hwang LY, Lee GC, et al. Prevention of perinatally transmitted hepatitis B virus infections with hepatitis B virus infections with hepatitis B immune globulin and hepatitis B vaccine. Lancet. 1983;2:1099–102. - PubMed

Publication types