. 2004 Jul 20;101(29):10726-31.
doi: 10.1073/pnas.0403649101. Epub 2004 Jul 9.

Alzheimer's brains harbor somatic mtDNA control-region mutations that suppress mitochondrial transcription and replication

Affiliations

Alzheimer's brains harbor somatic mtDNA control-region mutations that suppress mitochondrial transcription and replication

Pinar E Coskun et al. Proc Natl Acad Sci U S A. .

Abstract

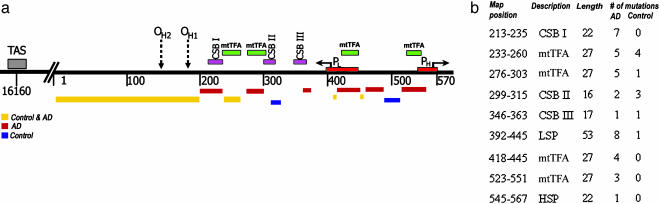
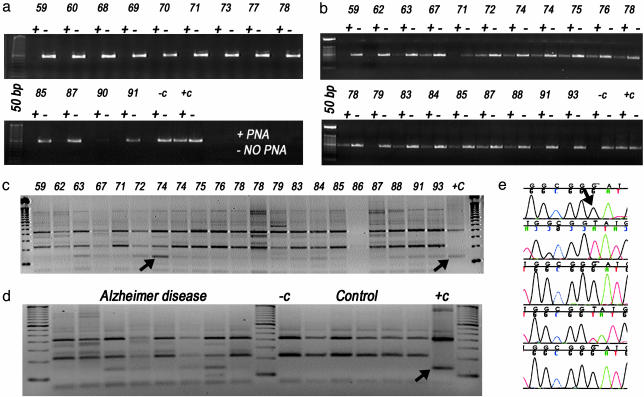
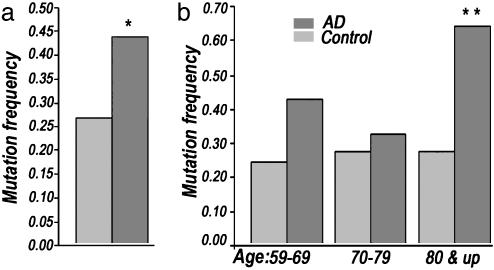
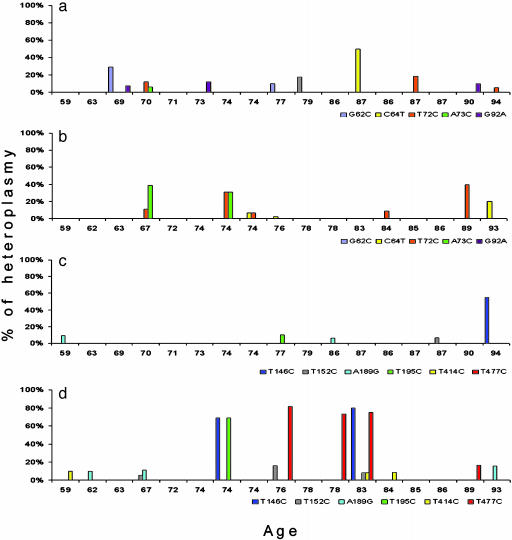
Defects in mitochondrial oxidative phosphorylation have frequently been associated with Alzheimer's disease (AD), and both inherited and somatic mtDNA mutations have been reported in certain AD cases. To determine whether mtDNA mutations contribute more generally to the etiology of AD, we have investigated the sequence of the mtDNA control region (CR) from AD brains for possible disease-causing mutations. Sixty-five percent of the AD brains harbored the T414G mutation, whereas this mutation was absent from all controls. Moreover, cloning and sequencing of the mtDNA CR from patient and control brains revealed that all AD brains had an average 63% increase in heteroplasmic mtDNA CR mutations and that AD brains from patients 80 years and older had a 130% increase in heteroplasmic CR mutations. In addition, these mutations preferentially altered known mtDNA regulatory elements. Certain AD brains harbored the disease-specific CR mutations T414C and T477C, and several AD brains between 74 and 83 years of age harbored the CR mutations T477C, T146C, and T195C, at levels up to 70-80% heteroplasmy. AD patient brains also had an average 50% reduction in the mtDNA L-strand ND6 transcript and in the mtDNA/nuclear DNA ratio. Because reduced ND6 mRNA and mtDNA copy numbers would reduce brain oxidative phosphorylation, these CR mutations could account for some of the mitochondrial defects observed in AD.


Figures

Fig. 1.
Fig. 1.
Representation of the somatic mtDNA CR mutation distribution in AD and control brains. (a) Schematic representation of nps 16000–570 of the mtDNA CR. The numbers below the line mark the mtDNA nps, and the boxes above the line represent the regulatory elements. The thick horizontal lines below the CR map represent the locations of the AD (red), control (blue), or common (gold) heteroplasmic mutations. (b) The number of heteroplasmic mutations in mtDNA CR regulatory elements in AD and control brains.
Fig. 2.
Fig. 2.
PNA-clamping PCR assay for T414G mtDNA mutation in AD and control brains. (a and b) Agarose gel results of controls (a) or AD patients (b). The individual samples in a and b are identified by the age of the subject. Two PCRs are shown for each subject, one in the absence (-) and the other in the presence (+) of a PNA encompassing the 414 wild-type base, which suppresses amplification of the wild-type mtDNA. (c and d) FokI digestion of the PNA-clamping PCR products was used to confirm the presence of the T414G mutation from AD brains (c) and from AD and control brains run into same gel for comparison (d). Lanes in c are labeled with age of AD patients. -c, the FokI digestion result from the PCR product from wild-type plasmid; +c, the result from a T414G mutant plasmid. The arrow indicates the T414G FokI product. (e) Sequence analysis of CR fragments from a 74-year-old subject. The 414 region was PNA-clamping PCR-amplified, the resulting fragments were reamplified without PNA, and the final fragments were cloned and sequenced. The mutant nucleotide G (indicated with an arrow) is seen in three of five clones.
Fig. 3.
Fig. 3.
Total number of heteroplasmic mtDNA CR mutations observed by cloning and sequencing CR clones from AD and control brain samples. (a) Number of mutants from all age groups (range 59–94); *, P < 0.01. (b) Number of mutants from three different age groups: 59–69, 70–79, and 80 & up; for 80 & up DNA mutation frequency, **, P < 0.001.
Fig. 4.
Fig. 4.
Specific somatic mtDNA CR mutants and their percentage of heteroplasmy in AD and control brains. Subjects are listed by age. CR nps 1–100: (a) control brains; (b) AD brains. CR nps 101–570: (c) control brains; (d) AD patient brains. The specific mutations are listed below the abscissa lines and color-coded. The percentage of each mutation in each individual's brain is given by the height of the bar of that color. Homoplasmic germ-line mutations were also observed for these mutations. For the np 1–100 region, A73G was seen in six ADs and four controls. In the np 101–570 region, T146C was seen in three ADs and two controls; T152C was seen in three ADs and four controls; A189G was seen in no ADs and one control; and T195C was seen in two ADs and two controls. T414C and T477C were not found in the homoplasmic state in either AD or control samples.

References

    1. Tandon, A., Rogaeva, E., Mullan, M. & St. George-Hyslop, P. H. (2000) Curr. Opin. Neurol. 13, 377-384. - PubMed
    1. Smith, M. A., Casadesus, G., Joseph, J. A. & Perry, G. (2002) Free Radical Biol. Med. 33, 1194-1199. - PubMed
    1. Castellani, R., Hirai, K., Aliev, G., Drew, K. L., Nunomura, A., Takeda, A., Cash, A. D., Obrenovich, M. E., Perry, G. & Smith, M. A. (2002) J. Neurosci. Res. 70, 357-360. - PubMed
    1. Harman, D. (2002) Ann. N.Y. Acad. Sci. 959, 384-395. - PubMed
    1. Cottrell, D. A., Borthwick, G. M., Johnson, M. A., Ince, P. G. & Turnbull, D. M. (2002) Neuropathol. Appl. Neurobiol. 28, 390-396. - PubMed

Publication types

Substances