Review
. 2004;8(1):1-34.
doi: 10.1177/108471380400800102.

Trends in cochlear implants

Affiliations
Review

Trends in cochlear implants

Fan-Gang Zeng. Trends Amplif. 2004.

Abstract

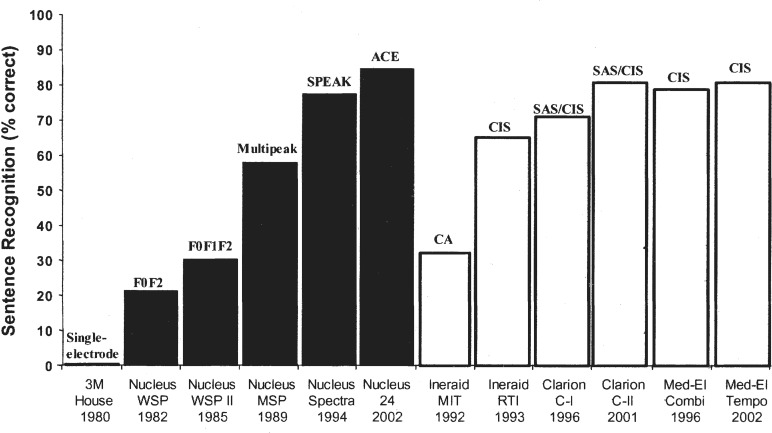
More than 60,000 people worldwide use cochlear implants as a means to restore functional hearing. Although individual performance variability is still high, an average implant user can talk on the phone in a quiet environment. Cochlear-implant research has also matured as a field, as evidenced by the exponential growth in both the patient population and scientific publication. The present report examines current issues related to audiologic, clinical, engineering, anatomic, and physiologic aspects of cochlear implants, focusing on their psychophysical, speech, music, and cognitive performance. This report also forecasts clinical and research trends related to presurgical evaluation, fitting protocols, signal processing, and postsurgical rehabilitation in cochlear implants. Finally, a future landscape in amplification is presented that requires a unique, yet complementary, contribution from hearing aids, middle ear implants, and cochlear implants to achieve a total solution to the entire spectrum of hearing loss treatment and management.


Figures

Figure 1.
Figure 1.
Speech recognition in cochlear-implant users. The x-axis labels show the type of device, the processor model, the place where the study was conducted, and the year the study was published. The y-axis shows percent correct scores for sentence recognition in quiet. The scores in earlier cochlear implants (House/3M, Nucleus WSP, WSP II, MSP, Ineraid MIT, and RTI) were averaged from investigative studies published in peer-reviewed journals. The scores in later devices were obtained from relatively large-scale company-sponsored clinical trials that had also been published in peer-reviewed journals. Except for a “single-electrode” for the 3M/House device, the text on top of the bars represent speech processing strategies including SPEAK (Spectral PEAK extraction), ACE (Advanced Combination Encoder), CA (Compressed Analog), CIS (Continuous Interleaved Sampler), and SAS (Simultaneous Analog Stimulation).
Figure 2.
Figure 2.
Annual number of publications for cochlear implants (the solid line) and hearing aids (the dashed line). The numbers were obtained by searching entries containing “cochlear AND implant” or “hearing AND aid” in the MEDLINE database (http://www.pubmed.gov). The search was performed on January 27, 2004.
Figure 3.
Figure 3.
Block diagram for key components in a typical cochlear implant system. First, a microphone (1) picks up the sound and sends it via a wire (2) to the speech processor (3) that is worn behind the ear or on the belt like a pager for older versions. The speech processor converts the sound into a digital signal according to the individual's degree of hearing loss. The signal travels back to a headpiece (4) that contains a coil transmitting coded radio frequencies across the skin. The headpiece is held in place by a magnet attracted to the implant (5) on the other side of the skin. The implant contains another coil that receives the radio frequency signal and also hermetically sealed electronic circuits. The circuits decode the signals, convert them into electric currents, and send them along wires threaded into the cochlea (6). The electrodes at the end of the wire (7) stimulate the auditory nerve (8) connected to the central nervous system, where the electrical impulses are interpreted as sound.
Figure 4.
Figure 4.
Block diagram for the Compressed-Analog cochlear (AGC) implant speech processor, adapted from Eddington et al., 1978. A microphone picks up the sound and the automatic gain control (AGC) circuit attenuates or amplifies the sound depending on the talker's vocal effort and distance from the receiver. The sound is then divided into four frequency bands by bandpass filters in this particular implementation. The narrow-band signal is compressed in amplitude by gain control to be within the narrow electric dynamic range (see the section on intensity, loudness, and dynamic range in psychophysical performance for details). The compressed band-specific analog signals are converted to currents and finally delivered to different intro-cochlear electrodes with the most apical electrode receiving the signal from the lowest frequency band and the most basal electrode receiving the signal from the highest frequency band.
Figure 5.
Figure 5.
Block diagram for the Continuous-Interleaved-Sampling cochlear implant speech processor, which is similar to the compressed-analog processor. The envelope, is compressed to match the narrow dynamic range in electric stimulation, and the envelope from each subband is then amplitude-modulated to a pulsatile carrier that interleaves with pulsatile carriers from other subbands. Adapted from (Wilson et al., 1991a).
Figure 6.
Figure 6.
Classification scheme for speech processing strategies in cochlear implants.
Figure 7.
Figure 7.
A representative intracochlear array for cochlear implants. The white rings on the black carrier represent electrode contacts, which in turn stimulate the nearby auditory neurons in the modiolus. The electrode array is inserted in the scala of tympani and folded into two complete turns.
Figure 8.
Figure 8.
Gap detection in electric hearing. The y-axis is the mean gap detection threshold in milliseconds and the x-axis is the second marker frequency (the first marker frequency is always at 100 Hz).
Figure 9.
Figure 9.
Overshoot in electric hearing. The y-axis is the detection threshold (dB re: 1 μA) for a brief signal and the x-axis is the delay in milliseconds (msec) from the onset of the masker (see text for details).
Figure 10.
Figure 10.
Schematic representation of how two interacting electrodes can reduce the number of independent neural or functional channels, which are represented by an array of arrows. The upper panel shows a case of two totally independent electrodes with each stimulating an independent neural channel (shaded rectangles) via relatively small degree of electric field spread (circles). The lower panel shows a case of two totally dependent electrodes with both stimulating the same neural channel via relatively large degree of electric field spread.
Figure 11.
Figure 11.
Changes in electric dynamic ranges caused by electrode interactions. Open symbols represent original T and M levels measured for individual electrodes in isolation. Solid symbols represent modified T and M levels measured using live speech as a calibration signal. The dashed line represents a suggested default setting of the T levels in the SAS processor.
Figure 12.
Figure 12.
An illustrative example of a stimulus waveform containing simple amplitude and frequency modulated tones (top trace). The Hilbert envelope is the amplitude modulation signal (middle trace), whereas the Hilbert fine structure is the frequency modulation signal (bottom trace), showing that the instantaneous frequency moving from low in the beginning to high in the middle and back to low at the end.
Figure 13.
Figure 13.
Speech recognition in subjects with normal hearing and with cochlear implants. The y-axis is the percent correct score and the x-axis is the number of spectral bands in cochlear implant simulations. The open triangles represent data obtained in quiet and the filled circles represent data obtained in noise. The horizontal dashed line represents cochlear implant performance in quiet while the vertical dashed line represents the equivalent number of spectral bands. The horizontal solid line represents implant performance in noise (10 dB SNR) while the vertical solid line represents equivalent number of spectral bands (see text for details).
Figure 14.
Figure 14.
A sound segregation and grouping model for combined acoustic and electric stimulation. Panel A shows speech temporal envelopes from signal (S) and noise (N). Panel B shows the combined envelopes of the signal and the noise. Panel C shows the two closed spaced perceptual streams between the signal and the noise in the presence of the temporal envelope cue alone. Panel D shows the two distinctively separated perceptual streams between the signal and the noise in the presence of the additional low-frequency fine structure cue (the thick solid line).
Figure 15.
Figure 15.
Mandarin tone recognition in normal hearing and cochlear implant subjects. The y-axis is the percent correct score for Mandarin tone recognition and the x-axis is either the number of electrodes available to cochlear implant subjects or the number of spectral bands available to normal-hearing subjects. Different open symbols represent individual implant data, and the thick line represents the average implant data. The solid triangles represent simulation data from normal listeners. The chance performance is 25% (the dotted line).
Figure 16.
Figure 16.
Melody (filled bars) and speech (open bars) recognition in cochlear implant subjects. The speech test was the identification of 12 vowels in a /hVd/ context. C2, C3, and C7 were Nucleus-22 SPEAK users, C6 and C8 were Clarion CIS users, and C9 was a Clarion SAS user.
Figure 17.
Figure 17.
Musical instrument identification in 3 normal-hearing (filled and open bars) and 5 cochlear implant (the hatched bar) subjects. The filled and the hatched bars represent data from the original, unprocessed stimuli, consisting of the following nine musical instruments: cello, clarinet, oboe, French horn, English horn, saxophone, trumpet, and viola. The subjects were trained on one pitch (a4) with trail-by-trail feedback and tested without feedback on another (c4). The open bars represent data from processed stimuli with their temporal envelopes extracted from 1, 2, 4, and 8 spectral bands.
Figure 18.
Figure 18.
Prediction of speech performance in cochlear implants. The y-axis is the actual performance, and the x-axis is the predicted performance. The dashed line represents prediction from a bottom-up, psychophysically based model. The dotted line represents prediction from a top-down, cognitive-based model. The solid diagonal line represents perfect prediction without any bias. See text for details.
Figure 19.
Figure 19.
Future amplification landscape for hearing aids, middle ear implants, and cochlear implants.

Similar articles

Cited by

References

    1. Abbas PJ, Brown CJ. Electrically evoked brainstem potentials in cochlear implant patients with multi-electrode stimulation. Hear Res 36: 153–162, 1988 - PubMed
    1. Andreev AM, Gersuni GV, Volokhov AA. On the electrical excitability of the human ear: On the effect of alternating currents on the affected auditory apparatus. J Physiol USSR 18: 250–265, 1935
    1. Arlinger S, Gatehouse S, Bentler RA, et al. Report of the Eriksholm Workshop on auditory deprivation and acclimatization. Ear Hear 17: 87S–98S, 1996 - PubMed
    1. Bekesy GV. Experiments in Hearing. New York: McGraw-Hill, 1960
    1. Bierer JA, Middlebrooks JC. Cortical responses to cochlear implant stimulation: Channel interactions. J Assoc Res Otolaryngol 5: 32–48, 2004 - PMC - PubMed

Publication types