. 2004 Jul 12:4:34.
doi: 10.1186/1471-2407-4-34.

Inhibition of macrophage migration inhibitory factor decreases proliferation and cytokine expression in bladder cancer cells

Affiliations

Inhibition of macrophage migration inhibitory factor decreases proliferation and cytokine expression in bladder cancer cells

Katherine L Meyer-Siegler et al. BMC Cancer. .

Abstract

Background: The importance of various inflammatory cytokines in maintaining tumor cell growth and viability is well established. Increased expression of the proinflammatory cytokine macrophage migration inhibitory factor (MIF) has previously been associated with various types of adenocarcinoma.

Methods: MIF IHC was used to localize MIF in human bladder tissue. ELISA and Western blot analysis determined the synthesis and secretion of MIF by human bladder transitional cell carcinoma cells. The effects of MIF inhibitors (high molecular weight hyaluronate (HA), anti-MIF antibody or MIF anti-sense) on cell growth and cytokine expression were analyzed.

Results: Human bladder cancer cells (HT-1376) secrete detectable amounts of MIF protein. Treatment with HA, anti-MIF antibody and MIF anti-sense reduced HT-1376 cell proliferation, MIF protein secretion, MIF gene expression and secreted inflammatory cytokines. Our evidence suggests MIF interacts with the invariant chain, CD74 and the major cell surface receptor for HA, CD44.

Conclusions: This study is the first to report MIF expression in the human bladder and these findings support a role for MIF in tumor cell proliferation. Since MIF participates in the inflammatory response and bladder cancer is associated with chronic inflammatory conditions, these new findings suggest that neutralizing bladder tumor MIF may serve as a novel therapeutic treatment for bladder carcinoma.


Figures

Figure 1
Figure 1
Localization of MIF in human bladder – A) MIF IHC – MIF protein is localized to the urothelial cells with mostly cytoplasmic staining and some evidence of perinuclear localization. The apical surface of the urothelial cells exhibits intense immunostaining (arrows). B) MIF in situ hybridization – MIF mRNA is localized primarily to the urothelial cytoplasm.
Figure 2
Figure 2
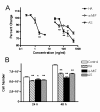
Effect of treatments on HT-1376 cell proliferation. A) Dose response curve – Effect of varying concentrations of HA, anti-MIF antibody and MIF anti-sense on HT-1376 cell growth over 24 h period. Data are expressed as percentage of control for each condition. Control conditions: HA, DMEM plus 1% BSA, anti-MIF antibody; non-specific mouse IgG1 at 50 μg/ml; antisense, MIF sense RNA at 2 ng/ml. The first dose to produce a statistically significant decrease in cell proliferation is listed for each treatment (* p < 0.05; ** p <0.01) and was used as the minimal effective dose for subsequent experiments. B) Minimal effective dose – Effect of minimal effective doses of HA, anti-MIF antibody and MIF anti-sense on HT-1376 cells following 24 and 48 h treatment. All treatments resulted in a decrease cell proliferation at both time periods, with a greater effects observed after 48 hours. Data are expressed as cell number as measured by MTS assay (* – p < 0.05, ** – p < 0.01)
Figure 3
Figure 3
Effect of treatments on MIF secretion, intracellular content and gene expression. A. MIF secretion – Conditioned medium following 24 h growth was assayed for MIF content by ELISA. Data are expressed as culture medium MIF concentration in pg per 105 cells. All treatments decreased MIF in the culture media. B. Western blot of anti-MIF treated conditioned medium following 24 h treatment- 12 kDa MIF band is present in all samples. Lane 1, DMEM 1% BSA; Lane 2, non-specific mouse IgG1; Lane 3, anti-MIF antibody treatment. C. Intracellular MIF content – Changes in intracellular MIF 24 h post treatment. Data are expressed as cleared cell lysate MIF concentration in pg per 105 cells. Note that HA treatment increased, while MIF antisense treatment decrease the concentration of MIF in the cell lysates. Anti-MIF treatment did not produce a significant effect. D. MIF gene expression -MIF mRNA content was quantified in cells following 24 h and the indicated treatment. Data are expressed as a relative intensity ratio. PCR band intensity was determined from the formula, total intensity = area × average intensity. The relative intensity ratio is determined from the total intensity of gene specific PCR product band divided by the 18 S rRNA band intensity (internal standard). All treatments resulted in a decrease in MIF mRNA with the greatest effects seen following MIF anti-sense treatment. (* – p < 0.05, ** – p < 0.01, *** – p < 0.001).
Figure 4
Figure 4
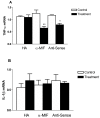
Effect of MIF Inhibition on TNF-α and IL-1β gene expression – A. TNF-α expression – TNF-α mRNA content was quantified in cells following 24 h with the indicated treatment. Anti-MIF and MIF antisense treatments decreased the levels of TNF-alpha mRNA. HA treatment, however, was not effective. B. IL-1β expression – IL-1β mRNA content was quantified in cells following 24 h with the indicated treatment. No significant difference in IL-1β expression was seen with any of the treatments. In both A and B the data is expressed as a relative intensity ratio. PCR band intensity was determined from the formula, total intensity = area × average intensity. The relative intensity ratio is determined from the total intensity of gene specific PCR product band divided by the 18 S rRNA band intensity (internal standard), (* – p < 0.05, ** – p < 0.01).
Figure 5
Figure 5
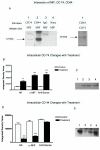
Effect of treatment on CD74 and CD44 proteins A. MIF pull down experiment – Cell lysates from 24 h control cultures were immunoprecipitated with CD74 antibody (lane 1) or CD44 antibody (lane 2,5) and the protein G binding protein complexes separated by polyacrylamide gel electrophoresis, followed by Western blotting using polyclonal anti-MIF or CD74 antibody. Lane 1, CD74 antibody; lane 2, CD44 antibody; lane 3, non-specific antibody; lane 4, no antibody added; lane 5, CD44 antibody. B. CD 74 Western blot analysis – Proteins in cell lysates from 24 h cultures treated with indicated reagents were separated by polyacrylamide gel electrophoresis, followed by Western blotting using polyclonal anti-CD74 antibody. Bands were quantified by digital imaging and are expressed as integrated density values (band area × relative intensity) and are presented as the mean ± SEM of three separate experiments of quadruplicate cultures. All treatments increased the levels of CD74 in the cell lysates. C. CD 74 Western blot – Proteins in cell lysates from 24 h cultures treated with indicated reagents were separated by polyacrylamide gel electrophoresis, followed by Western blotting using polyclonal anti-CD74 antibody. Blot is representative of those from three separate experiments. D. CD 44 Western blot analysis – Proteins in cell lysates from 24 h cultures treated with indicated reagents were separated by polyacrylamide gel electrophoresis, followed by Western blotting using polyclonal anti-CD44 antibody. Bands were quantified by digital imaging and are expressed as integrated density values (band area × relative intensity) and are presented as the mean ± SEM of three separate experiments of quadruplicate cultures. HA and anti-MIF treatments significantly decreased the levels of CD44 in cell lysates. MIF antisense had no effect. E. CD 44 Western blot – Proteins in cell lysates from 24 h cultures treated with indicated reagents were separated by polyacrylamide gel electrophoresis, followed by Western blotting using polyclonal anti-CD44 antibody. Blot is representative of those from three separate experiments.(** – p < 0.01, *** – p < 0.001).

Similar articles

Cited by

References

    1. Jemal A, Murray T, Samuels A, Ghafoor A, Ward E, Thun MJ. Cancer statistics. CA Cancer J Clin. 2003;53:5–26. - PubMed
    1. Small EJ, Halabi S, Dalbagni G, Pruthi R, Phillips G, Edelman M, Bajorin D, Cancer and Leukemia Group B Overview of bladder cancer trials in the cancer and leukemia group B. Cancer. 2003;97:2090–2098. doi: 10.1002/cncr.11299. - DOI - PubMed
    1. Piazza GA, Thompson WJ, Pamukeu R, Alila HW, Whitehead CM, Liu L, Fetter JR, Gresh WE, Jr, Klein-Szanto AJ, Farnell DR, Eto I, Grubbs CJ. Exisulind, a novel proapoptotic drug, inhibits rat urinary bladder tumorigenesis. Cancer Res. 2001;61:3961–3968. - PubMed
    1. Herr HW, Badalament RA, Amato DA, Laudone VP, Fair WR, Whitmore WF., Jr Superficial bladder cancer treated with bacillus Calmette-Guerin: a multivariate analysis of factors affecting tumor progression. J Urol. 1989;141:22–29. - PubMed
    1. La Vecchia C, Negri E, D'Avanzo B, Savoldelli R, Francesci S. Genital and urinary tract disease and bladder cancer. Cancer Res. 1991;51:629–631. - PubMed

Publication types

MeSH terms