. 2004 Jul 20;101(29):10804-9.
doi: 10.1073/pnas.0400348101. Epub 2004 Jul 12.

O-GlcNAcylation regulates phosphorylation of tau: a mechanism involved in Alzheimer's disease

Affiliations

O-GlcNAcylation regulates phosphorylation of tau: a mechanism involved in Alzheimer's disease

Fei Liu et al. Proc Natl Acad Sci U S A. .

Abstract

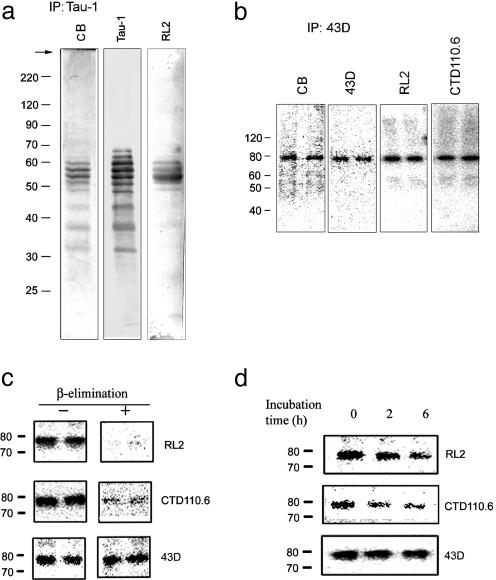
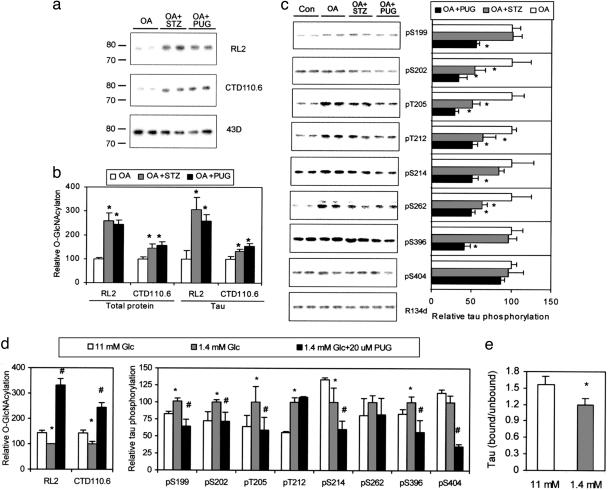
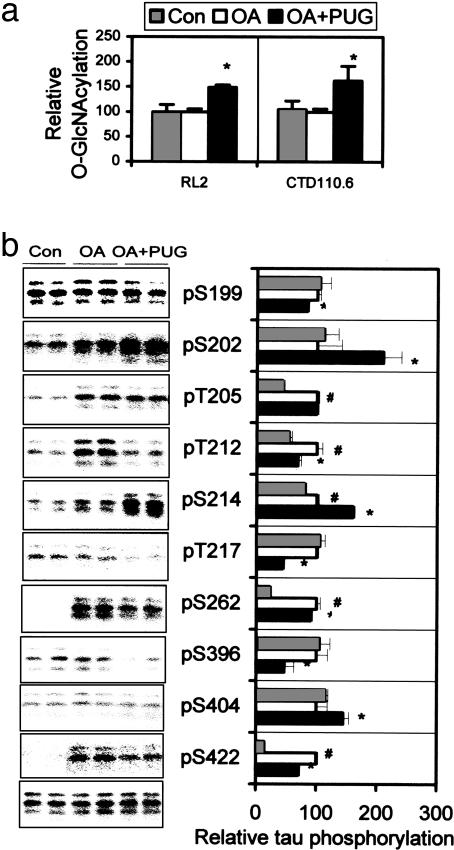
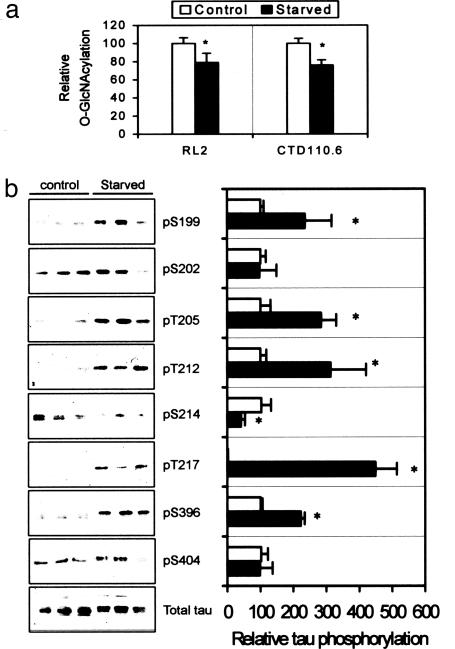
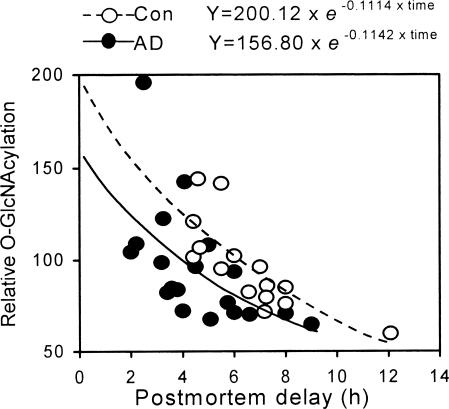
Microtubule-associated protein tau is abnormally hyperphosphorylated and aggregated into neurofibrillary tangles in brains of individuals with Alzheimer's disease (AD) and other tauopathies. Tau pathology is critical to pathogenesis and correlates to the severity of dementia. However, the mechanisms leading to abnormal hyperphosphorylation are unknown. Here, we demonstrate that human brain tau was modified by O-GlcNAcylation, a type of protein O-glycosylation by which the monosaccharide beta-N-acetylglucosamine (GlcNAc) attaches to serine/threonine residues via an O-linked glycosidic bond. O-GlcNAcylation regulated phosphorylation of tau in a site-specific manner both in vitro and in vivo. At most of the phosphorylation sites, O-GlcNAcylation negatively regulated tau phosphorylation. In an animal model of starved mice, low glucose uptake/metabolism that mimicked those observed in AD brain produced a decrease in O-GlcNAcylation and consequent hyperphosphorylation of tau at the majority of the phosphorylation sites. The O-GlcNAcylation level in AD brain extracts was decreased as compared to that in controls. These results reveal a mechanism of regulation of tau phosphorylation and suggest that abnormal hyperphosphorylation of tau could result from decreased tau O-GlcNAcylation, which probably is induced by deficient brain glucose uptake/metabolism in AD and other tauopathies.


Figures

Fig. 1.
Fig. 1.
O-GlcNAcylation of human brain tau. (a) Immunoaffinity-purified tau from human brain was resolved by 10% SDS/PAGE and then stained with Coomassie blue (CB) or immunolabeled with antibodies Tau-1 to tau or RL2 to O-GlcNAc. (b) Recombinant human tau441 immunoaffinity-purified from PC12 cells was analyzed by 10% SDS/PAGE and stained with CB, antibodies 43D to tau, or RL2 and CTD110.6 to O-GlcNAc. (c) Tau441 from PC12 cells was analyzed by Western blots (+) with or (-) without β-elimination on the blots. (d) Tau441 was analyzed by Western blots after β-elimination in test tubes for 0, 2, and 6 h.
Fig. 2.
Fig. 2.
Regulation of tau phosphorylation by O-GlcNAcylation in differentiated PC12 cells that stably expressed human tau441.(a) Tau was first immunoaffinity-purified by using phospho-independent tau antibody 43D from PC12 cells treated with OA alone or in combination with either STZ or PUGNAc and then examined by using Western blots developed with O-GlcNAc-specific antibodies RL2 and CTD110.6 or with 43D. (b) The O-GlcNAcylation levels of lysate proteins and immunoaffinity-purified tau were quantitated by 125I-Western blots developed with RL2 and CTD110.6. *, P < 0.05 versus OA group. (c) (Left) The level and phosphorylation state of tau were analyzed by 125I-Western blots developed with phosphorylation-independent tau antibody R134d and phosphorylation-dependent and site-specific tau antibodies, respectively, as indicated. (Right) Quantitations of these blots after normalization with the R134d blot are shown. Mean ± SD of three to four separate experiments is shown. *, P < 0.05 versus OA group. (d) PC12 cells were cultured in medium containing normal (11 mM) or low (1.4 mM) concentration of Glc with or without PUGNAc for 2 days, and then the levels of protein O-GlcNAcylation and tau phosphorylation of the lysates were determined by 125I-Western blots. (e) The microtubule-bound tau and -unbound tau were quantitated by 125I-Western blots. Data in d are the quantitations of the blots after normalization with R134d blot. Mean ± SD of three to four separate experiments is shown in d and e. *, P < 0.05 versus 11 mM Glc group; #, P < 0.05 versus 1.4 mM Glc group.
Fig. 3.
Fig. 3.
Regulation of tau phosphorylation by O-GlcNAcylation in metabolically active rat brain slices. (a) Rat brain slices were incubated with artificial cerebrospinal fluid alone or plus either OA or OA and PUGNAc. Then the O-GlcNAcylation level of the tissue homogenates was determined by 125I-Western blots developed with RL2 and CTD110.6. (b Left) The level and phosphorylation state of tau in the brain slice homogenates were analyzed by 125I-Western blots developed with R134d (bottom blot) and several phosphorylation-dependent tau antibodies as indicated, respectively. (b Right) The quantitation of these blots after normalization with total tau is shown as mean ± SD. *, P < 0.05 versus OA group; #, P < 0.05 versus control group.
Fig. 4.
Fig. 4.
Effect of starvation on O-GlcNAcylation and phosphorylation of tau in mice. (a) Protein O-GlcNAcylation level of brain homogenates of mice after starvation for 48 h was analyzed by 125I-Western blots with anti-O-GlcNAc antibodies. (b Left) The level and phosphorylation state of tau in the brain homogenates were analyzed by 125I-Western blots developed with R134d (total tau) and several phosphorylation-dependent tau antibodies, respectively, as indicated. No significant immunostaining with antibodies against pS262 or pS422 was detected (data not shown). (b Right) The quantitation of these blots after normalization with total tau is shown as mean ± SD. The tau phosphorylation levels of control were defined as 100 for all sites, except that of pT217 was defined as 1. *, P < 0.05 versus control groups.
Fig. 5.
Fig. 5.
Level of O-GlcNAcylation in AD and control (Con) brains. The O-GlcNAcylation level of cytosolic proteins from 19 AD and 15 control brains was determined by radioimmuno-dot-blots with antibody RL2 and plotted against the postmortem delay of the brains. Equations of nonlinear analysis of each group are shown on the top, where Y is relative O-GlcNAcylation level, and time is postmortem delay (h).

References

    1. Grundke-Iqbal, I., Iqbal, K., Quinlan, M., Tung, Y. C., Zaidi, M. S. & Wisniewski, H. M. (1986) J. Biol. Chem. 261, 6084-6089. - PubMed
    1. Ihara, Y., Nukina, N., Miura, R. & Ogawara, M. (1986) J. Biochem. (Tokyo) 99, 1807-1810. - PubMed
    1. Lee, V. M.-Y., Balin, B. J., Otvos, L. & Trojanowski, J. Q. (1991) Science 251, 675-678. - PubMed
    1. Goedert, M., Spillantini, M. G., Jakes, R., Rutherford, D. & Crowther, R. A. (1989) Neuron 3, 519-526. - PubMed
    1. Goedert, M., Spillantini, M. G., Cairns, N. J. & Crowther, R. A. (1992) Neuron 8, 159-168. - PubMed

Publication types

MeSH terms