. 2004 Jul 20;101(29):10639-43.
doi: 10.1073/pnas.0400941101. Epub 2004 Jul 12.

The mitochondrial genome of Paraspadella gotoi is highly reduced and reveals that chaetognaths are a sister group to protostomes

Affiliations

The mitochondrial genome of Paraspadella gotoi is highly reduced and reveals that chaetognaths are a sister group to protostomes

Kevin G Helfenbein et al. Proc Natl Acad Sci U S A. .

Abstract

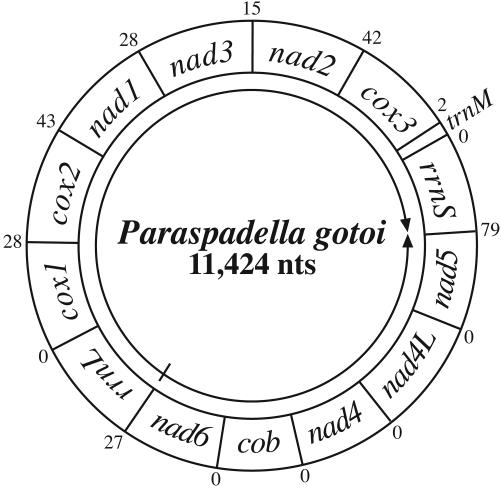
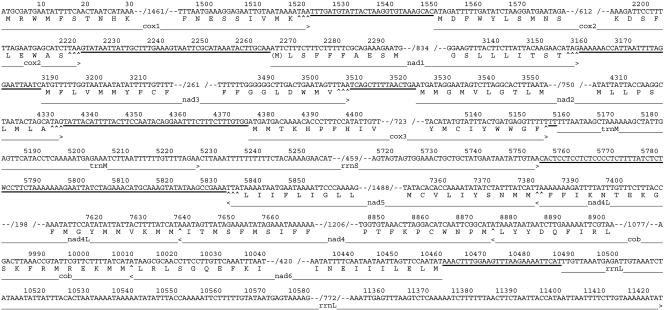
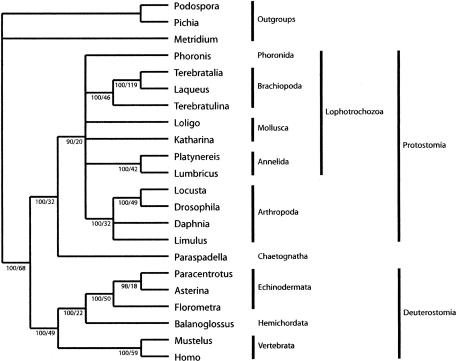
We report the complete mtDNA sequence from a member of the phylum Chaetognatha (arrow worms). The Paraspadella gotoi mtDNA is highly unusual, missing 23 of the genes commonly found in animal mtDNAs, including atp6, which has otherwise been found universally to be present. Its 14 genes are unusually arranged into two groups, one on each strand. One group is punctuated by numerous noncoding intergenic nucleotides although the other group is tightly packed, having no noncoding nucleotides, leading to speculation that there are two transcription units with differing modes of expression. The phylogenetic position of the Chaetognatha within the Metazoa has long been uncertain, with conflicting or equivocal results from various morphological analyses and rRNA sequence comparisons. Comparisons here of amino acid sequences from mitochondrially encoded proteins give a single most parsimonious tree that supports a position of Chaetognatha as sister to the protostomes studied here. From this analysis, one can more clearly interpret the patterns of evolution of various developmental features, especially regarding the embryological fate of the blastopore.


Figures

Fig. 1.
Fig. 1.
Electrophoretic gels of PCR products of the P. gotoi mtDNA. (Left) A “1 kb plus” ladder followed by a PCR fragment of 6,578 bp generated by using the cox1 reverse primer and cox3 forward primer. (Right) PCR fragment of 4,054 bp generated by using the cox1 forward primer and cox3 reverse primer followed by a mass standard, then a 1-kb standard. Exact sizes were determined by sequencing.
Fig. 2.
Fig. 2.
Gene map of the P. gotoi mtDNA. Genes are transcribed left to right as they are read (rrnL to rrnS clockwise, nad6 to nad5 counterclockwise) as marked by the arrows. Gene sizes are not to scale. Numerals outside of the map indicate the number of nucleotides intervening between each pair of genes; those flanking rrnS and rrnL are estimates based on the extent of alignment of these genes with those of other animals but remain uncertain.
Fig. 3.
Fig. 3.
Abbreviated mtDNA sequence of P. gotoi shown graphically linearized at the beginning of cox1. Numerals within the slash marks indicate number of omitted nucleotides. Noncoding nucleotides, including the largest noncoding region, are underlined. A dart (>) marks the last nucleotide for each gene and indicates the direction of transcription. Nucleotides of termination codons of protein-coding genes, complete or abbreviated (see Genome Evolution), are underscored with carats (^). All genes are inferred to initiate with formyl-methionine regardless of the actual start codon; thus, this amino acid is shown in parentheses when not conforming to the genetic code.
Fig. 4.
Fig. 4.
The single most parsimonious tree recovered from analysis of 2,785 aligned positions of inferred amino acids from eight mitochondrial protein genes (cob, cox1, cox2, cox3, nad1, nad3, nad4, and nad5). Of these, 1,802 positions are parsimony informative. Consistency index (CI) is 0.595 and retention index (RI) is 0.400. Numbers below branches are percent bootstrap support followed by Bremer support values. The latter indicates the number of evolutionary changes in the shortest tree that does not contain the node in question. Nodes with a bootstrap value of <90% (of which the highest was 50%) have been collapsed; these have a Bremer support in the range of 3–8.

References

    1. Brusca, R. C. & Brusca, G. J. (1990) Invertebrates (Sinauer, Sunderland, MA).
    1. Nielsen, C., Scharff, N. & Eibye-Jacobsen, D. (1996) Biol. J. Linn. Soc. 57, 385–410.
    1. Giribet, G., Distel, D. L., Polz, M., Sterrer, W. & Wheeler, W. C. (2000) Syst. Biol. 49, 539–562. - PubMed
    1. Boore, J. L. (1999) Nucleic Acids Res. 27, 1767–1780. - PMC - PubMed
    1. Boore, J. L. & Brown, W. M. (1998) Curr. Opin. Genet. Dev. 8, 668–674. - PubMed

Publication types