

Somatolactin selectively regulates proliferation and morphogenesis of neural-crest derived pigment cells in medaka
- PMID: 15249680
- PMCID: PMC489991
- DOI: 10.1073/pnas.0401278101
Somatolactin selectively regulates proliferation and morphogenesis of neural-crest derived pigment cells in medaka
Abstract
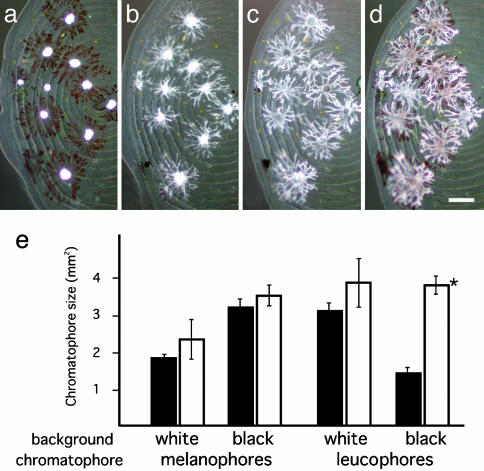
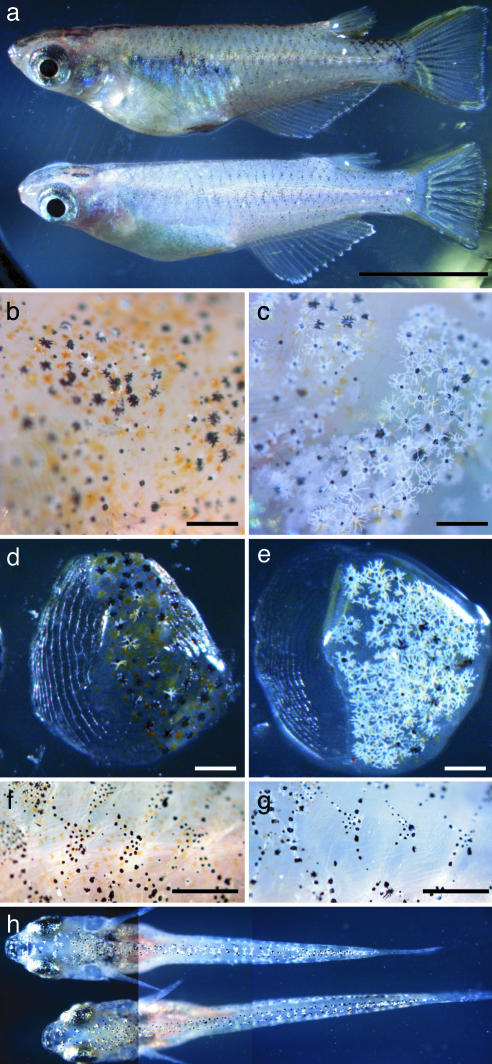
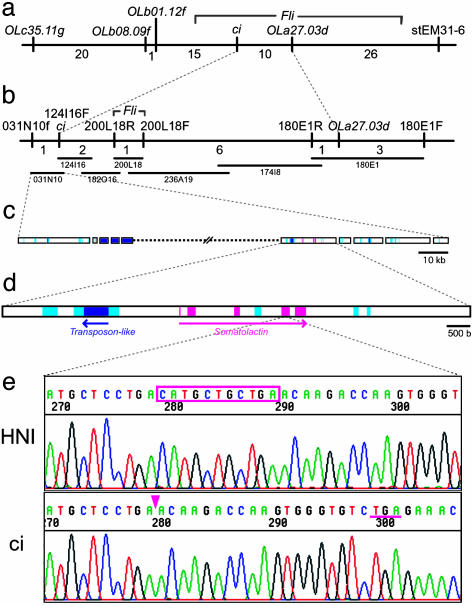
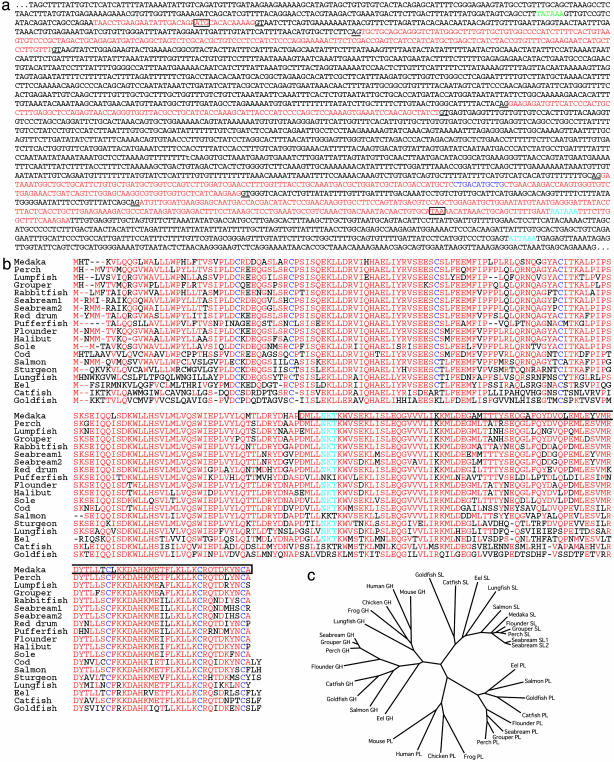
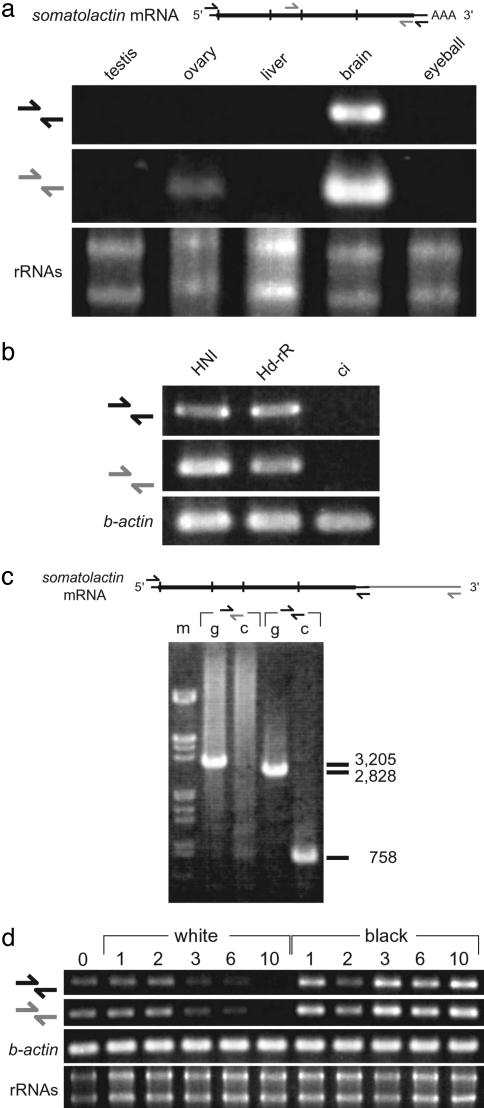
Species-specific colors and patterns on animal body surfaces are determined primarily by neural-crest-derived pigment cells in the skin (chromatophores). However, even closely related species display widely differing patterns. These contrasting aspects of chromatophores (i.e., the fixed developmental control within species and extreme diversity among species) seem to be a curious and suitable subject for understanding evolution and diversity of organisms. Here we identify a gene responsible for medaka "color interfere" mutants by positional cloning. These mutants do not show any obvious morphological and physiological defects other than defects in chromatophore proliferation and morphogenesis. The mutation has been identified as an 11-base deletion in somatolactin, which causes truncation 91 aa upstream of the C terminus of the protein's 230 aa. Somatolactin transcription changed dramatically during morphological body color adaptation to different backgrounds. This genetic evidence explains somatolactin function. Studying this mutant will provide further insights into the development and regulation of chromatophores and clues for reassessing other functions of somatolactin suggested in other fish.
Figures
Similar articles
-
Medaka double mutants for color interfere and leucophore free: characterization of the xanthophore-somatolactin relationship using the leucophore free gene.Dev Genes Evol. 2006 Mar;216(3):152-7. doi: 10.1007/s00427-005-0040-9. Epub 2005 Dec 13. Dev Genes Evol. 2006. PMID: 16344968
-
Leucophores are similar to xanthophores in their specification and differentiation processes in medaka.Proc Natl Acad Sci U S A. 2014 May 20;111(20):7343-8. doi: 10.1073/pnas.1311254111. Epub 2014 May 6. Proc Natl Acad Sci U S A. 2014. PMID: 24803434 Free PMC article.
-
Effects of constitutive expression of somatolactin alpha on skin pigmentation in medaka.Gene. 2009 Aug 1;442(1-2):81-7. doi: 10.1016/j.gene.2009.04.010. Epub 2009 Apr 22. Gene. 2009. PMID: 19393303
-
Melanin-concentrating hormone like and somatolactin. A teleost-specific hypothalamic-hypophyseal axis system linking physiological and morphological pigmentation.Pigment Cell Melanoma Res. 2021 May;34(3):564-574. doi: 10.1111/pcmr.12924. Epub 2020 Sep 20. Pigment Cell Melanoma Res. 2021. PMID: 32898924 Review.
-
Pigment pattern formation in the medaka embryo.Pigment Cell Res. 2005 Apr;18(2):64-73. doi: 10.1111/j.1600-0749.2005.00216.x. Pigment Cell Res. 2005. PMID: 15760335 Review.
Cited by
-
Evolutionarily conserved role of hps1 in melanin production and blood coagulation in medaka fish.G3 (Bethesda). 2022 Sep 30;12(10):jkac204. doi: 10.1093/g3journal/jkac204. G3 (Bethesda). 2022. PMID: 35944207 Free PMC article.
-
Origins of adult pigmentation: diversity in pigment stem cell lineages and implications for pattern evolution.Pigment Cell Melanoma Res. 2015 Jan;28(1):31-50. doi: 10.1111/pcmr.12332. Epub 2014 Dec 16. Pigment Cell Melanoma Res. 2015. PMID: 25421288 Free PMC article. Review.
-
Medaka double mutants for color interfere and leucophore free: characterization of the xanthophore-somatolactin relationship using the leucophore free gene.Dev Genes Evol. 2006 Mar;216(3):152-7. doi: 10.1007/s00427-005-0040-9. Epub 2005 Dec 13. Dev Genes Evol. 2006. PMID: 16344968
-
Mapping of pigmentation QTL on an anchored genome assembly of the cichlid fish, Metriaclima zebra.BMC Genomics. 2013 Apr 27;14:287. doi: 10.1186/1471-2164-14-287. BMC Genomics. 2013. PMID: 23622422 Free PMC article.
-
Reassessment of the function of somatolactin alpha in lipid metabolism using medaka mutant and transgenic strains.BMC Genet. 2012 Jul 24;13:64. doi: 10.1186/1471-2156-13-64. BMC Genet. 2012. PMID: 22827540 Free PMC article.
References
-
- Nakamura, M., Tobin, D. J., Richards-Smith, B., Sundberg, J. P. & Paus, R. (2002) J. Dermatol. Sci. 28, 1–33. - PubMed
-
- Walls, G. L. (1942) The Vertebrate Eye and Its Adaptive Radiation (Cranbrook Institute of Science, Bloomfield Hills, MI).
-
- Wittbrodt, J., Shima, A. & Schartl, M. (2002) Nat. Rev. Genet. 3, 53–64. - PubMed
-
- Nelson, J. S. (1994) Fishes of the World (Wiley, New York).
-
- Tomita, H. (1990) in Biology of the Medaka, eds. Egami, N., Yamagami, K. & Shima, A. (Univ. of Tokyo Press, Tokyo), pp. 111–128.
Publication types
MeSH terms
Substances
Associated data
- Actions
- Actions
LinkOut - more resources
Full Text Sources
Research Materials
