. 2004 Jul 20;101(29):10667-72.
doi: 10.1073/pnas.0401720101. Epub 2004 Jul 12.

Pattern of polymorphism after strong artificial selection in a domestication event

Affiliations

Pattern of polymorphism after strong artificial selection in a domestication event

Hideki Innan et al. Proc Natl Acad Sci U S A. .

Abstract

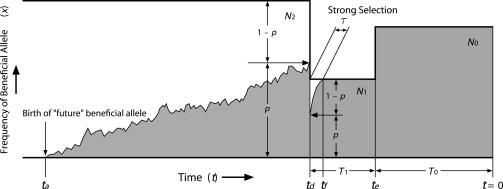
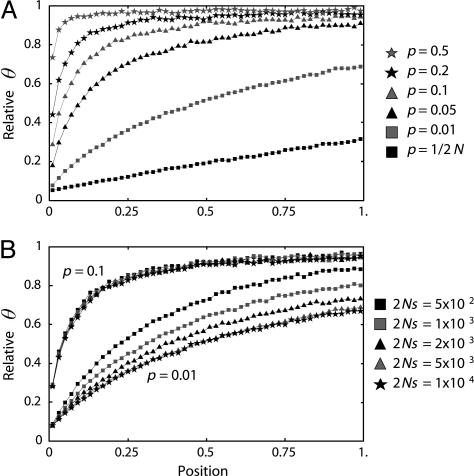
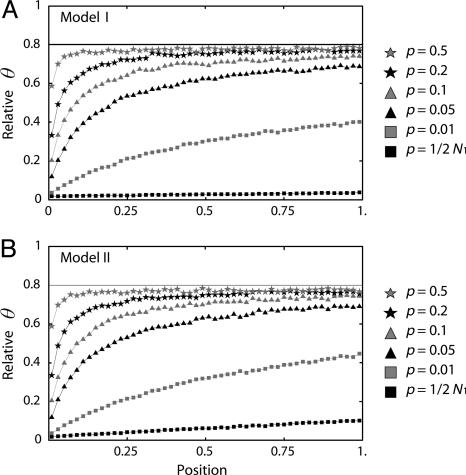
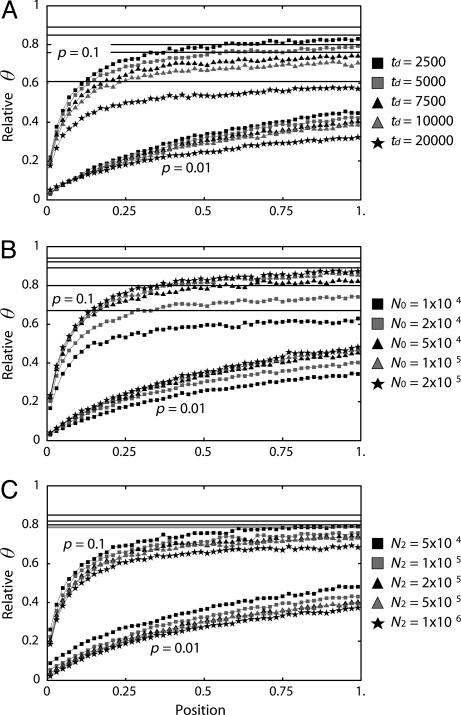
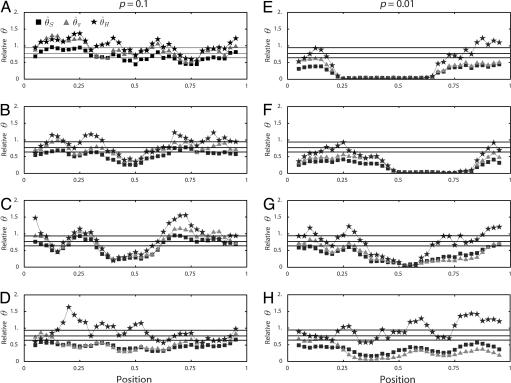
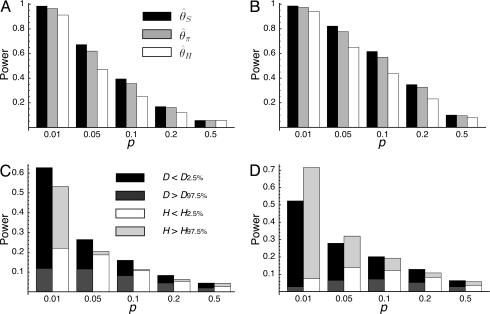
The process of strong artificial selection during a domestication event is modeled, and its effect on the pattern of DNA polymorphism is investigated. The model also considers population bottleneck during domestication. Artificial selection during domestication is different from a regular selective sweep because artificial selection acts on alleles that may have been neutral variants before domestication. Therefore, the fixation of such a beneficial allele does not always wipe out DNA variation in the surrounding region. The amount by which variation is reduced largely depends on the initial frequency of the beneficial allele, p. As a consequence, p has a strong effect on the likelihood of detecting the signature of selection during domestication from patterns of polymorphism. These theoretical results are discussed in light of data collected from maize. Although the main focus of this article is on domestication, this model can also be generalized to describe selective sweeps from standing genetic variation.


Figures

Fig. 1.
Fig. 1.
Illustration of the population model. At td, strong artificial selection becomes active on an allele at frequency p, which was neutral in the ancestral population. The allele fixed quickly under strong artificial selection. A possible realization of the trajectory of the frequency of the beneficial allele is also illustrated. The vertical axis represents the frequency of the beneficial allele.
Fig. 2.
Fig. 2.
The expected level of polymorphism (θπ) in a constant-size population, which is scaled by θ.(A) The effect of p.(B) The effect of selection intensity (2Ns).
Fig. 3.
Fig. 3.
The expected level of polymorphism (θπ) after a domestication event, which is scaled by θ2. In both models I (A) and II (B), formula image, which is presented by a horizontal line. The simulated region correspond to an 8-kb region if we assume θ2 = R2 = 0.025 per site, which may be within typical ranges for maize (3).
Fig. 4.
Fig. 4.
The effects of td, N0, and N2 on the expected level of polymorphism (θπ) after a domestication event. The simulated region corresponds to an 8-kb region if we assume θ2 = R2 = 0.025 per site. (A) The effect of td. The five horizontal lines represent formula image for td = 2,500, 5,000, 7,500, 10,000, and 20,000 from top to bottom. (B) The effect of N0. The five horizontal lines represent formula image for N0 = 104, 2 × 10⁴, 5 × 10⁴, 105, and 2 × 10⁵ from bottom to top. (C) The effect of N2. The five horizontal lines represent formula image for N2 = 5 × 10⁴, 105, 2 × 10⁵, 5 × 10⁵, and 106 from top to bottom.
Fig. 5.
Fig. 5.
Patterns of polymorphism after a domestication event. (AH) Each panel shows the result from an independent simulation run. Three horizontal lines represent formula image, and formula image from top to bottom. The simulated region corresponds to a 10-kb region if we assume θ2 = R2 = 0.025 per site.
Fig. 6.
Fig. 6.
Power of tests to detect domestication selection. The probabilities to obtain significant result at the 5% level are shown. (A) The power of the HKA test for θ2 = R2 = 125 (5 kb if θ2 = R2 = 0.025 per site). (B) The power of the HKA test for θ2 = R2 = 31.25 (1.25 kb if θ2 = R2 = 0.025 per site). (C) The powers of Tajima's D and Fay and Wu's H tests for θ2 = R2 = 125. (D) The powers of Tajima's D and Fay and Wu's H tests for θ2 = R2 = 31.25.

References

    1. Kaplan, N. L., Hudson, R. R. & Langley, C. H. (1989) Genetics 123, 887–899. - PMC - PubMed
    1. Purugganan, M. D., Boyles, A. L. & Suddith, J. I. (2000) Genetics 155, 855–862. - PMC - PubMed
    1. Eyre-Walker, A., Gaut, R. L., Hilton, H., Feldman, D. L. & Gaut, B. S. (1998) Proc. Natl. Acad. Sci. USA 95, 4441–4446. - PMC - PubMed
    1. Tenaillon, M. I., U'Ren, J., Tenaillon, O. & Gaut, B. S. (2004) Mol. Biol. Evol. 21, 1214–1225. - PubMed
    1. Buckler, E. S., IV, Thornsberry, J. M. & Kresovich, S. (2001) Genet. Res. Camb. 77, 213–218. - PubMed

Publication types