. 2004 Nov 15;104(10):3097-105.
doi: 10.1182/blood-2004-03-1224. Epub 2004 Jul 13.

A requirement for Notch1 distinguishes 2 phases of definitive hematopoiesis during development

Affiliations

A requirement for Notch1 distinguishes 2 phases of definitive hematopoiesis during development

Brandon K Hadland et al. Blood. .

Abstract

Notch1 is known to play a critical role in regulating fates in numerous cell types, including those of the hematopoietic lineage. Multiple defects exhibited by Notch1-deficient embryos confound the determination of Notch1 function in early hematopoietic development in vivo. To overcome this limitation, we examined the developmental potential of Notch1(-/-) embryonic stem (ES) cells by in vitro differentiation and by in vivo chimera analysis. Notch1 was found to affect primitive erythropoiesis differentially during ES cell differentiation and in vivo, and this result reflected an important difference in the regulation of Notch1 expression during ES cell differentiation relative to the developing mouse embryo. Notch1 was dispensable for the onset of definitive hematopoiesis both in vitro and in vivo in that Notch1(-/-) definitive progenitors could be detected in differentiating ES cells as well as in the yolk sac and early fetal liver of chimeric mice. Despite the fact that Notch1(-/-) cells can give rise to multiple types of definitive progenitors in early development, Notch1(-/-) cells failed to contribute to long-term definitive hematopoiesis past the early fetal liver stage in the context of a wild-type environment in chimeric mice. Thus, Notch1 is required, in a cell-autonomous manner, for the establishment of long-term, definitive hematopoietic stem cells (HSCs).


Figures

Figure 1
Figure 1. Notch1-deficient ES cell lines (Notch1in32 allele) exhibit no defect in proliferation, embryoid body (EB) plating efficiency or growth, or differentiation of the early flk1+ population
(A) ES cell proliferation curve. ES cells were plated on day 0 at a density of 5 × 10⁴ cells/mL in 24-well plates. On subsequent days, samples were trypsinized and total cell numbers counted. Values represent the average of 3 samples and error bars indicate standard deviation (SD). Wild-type (+/+), heterozygous (+/−), and 2 independently derived null ES lines (−/−) are shown. (B-C) ES cells, predifferentiated for 2 days without the STO-neo feeder layer but in the presence of LIF, were trypsinized and plated in methylcellulose without exogenous cytokines (B) or in liquid suspension culture (C), at a density of 2 × 10⁴ cells/mL. Total number of EBs were counted at day 4 (B). At days 6 and 12, EBs were pooled and the maximum diameters of at least 30 EBs were measured for each sample (C). Values represent the average of 3 replicate platings from one experiment and error bars indicate SD. Similar results were obtained for several independent experiments. Wild type (+/+), Notch1 heterozygous (+/−), and 2 independently derived Notch1 null (−/−) ES cell lines. (D) FACS analysis of flk-1 expression in Notch1−/− and Notch1+/− EBs differentiated for 3.75 days. EBs were dissociated to single-cell suspension and stained with an antibody to flk-1, conjugated to phycoerythrin. The profile indicated by a dotted line represents unstained EB cells. Similar results were obtained in 2 independent experiments, and with additional Notch1−/− and control cell lines. Percentage of cells in the M2 window is shown.
Figure 2
Figure 2. Notch1-deficient (Notch1in32 allele) and γ-secretase inhibitor–treated embryoid bodies (EBs), but not Notch1-deficient embryos (Notch1Δ1 allele), produce expanded primitive erythroid colony-forming unit (CFU-EryP) progenitors
(A) Kinetic analysis of primitive erythroid progenitor formation from EBs at various stages of differentiation. EBs differentiated in liquid culture for 2.5 to 9 days were assayed for CFU-EryP. Values represent the average of 3 replicate platings. Similar results were obtained in at least 4 independent experiments performed in EBs differentiated for 4 to 6 days. Wild type (+/+), Notch1 heterozygous (+/−), and 2 independently derived Notch1 null (−/−) ES cell lines were examined. (B) Wild-type EBs were treated at 1.5, 2.5, or 3.5 days of differentiation with a single dose of the γ-secretase inhibitor Cpd no. 11 (50 μM) or with the carrier alone, DMSO, as a control. Primitive erythroid progenitors (CFU-EryP) were then assayed at day 5 of differentiation. Values represent the average of 3 replicate platings. Similar results were obtained in an independent experiment. (C) Wild-type EBs were treated at day 3.5 of differentiation with a single dose of the γ-secretase inhibitor, DAPT (1 μM), or with the carrier, DMSO, as a control. Primitive erythroid progenitors (CFU-EryP) were then assayed at day 4.75 of differentiation (P<.01, Student t test). Values represent the average of 3 replicate platings. (D) CFU-EryPs were assayed from Notch1-deficient CD1 embryos (−/−) or heterozygous and wild-type (+/− or +/+) littermate controls from approximately day 7.25 to 8.5 dpc. Each time point represents the average number of CFUs from Notch1-deficient (−/−) or control (+/− or +/+) littermate embryos whose approximate chronologic age was based on morphology and/or somite numbers. Similar results not shown in this graph were obtained in additional experiments performed at various embryonic stages. Approx indicates approximately.
Figure 3
Figure 3. Expression of Notch1 during ES cell differentiation and in vivo
(A) Western blot analysis of Notch1 expression during EB differentiation. Roughly equal levels of total protein (as determined by serial dilution and Coomassie staining) from lysates of ES cells (plated in the absence of feeder cells) or EBs at the indicated ages (in days) were used to compare endogenous Notch1 protein levels using an anti-Notch1 antibody (AN1). Since the antibody is part of the intracellular domain of Notch1, it detects an approximately 120-kDa band, the transmembrane intracellular (TMIC) portion of Notch1 that is formed during processing of the full-length protein during transport to the cell surface. Analysis was also performed on Notch1-deficient ES cells as a negative control. WT indicates wild type. (B) FACS analysis of Notch1 expression in ES cells and developing embryoid bodies (EBs) at various days of differentiation. ES or EB cells were treated to form a single-cell suspension and stained with a rabbit antibody to the extracellular domain of Notch1, followed by antirabbit biotin secondary and finally streptavidin phycoerythrin. Profiles indicated by dotted lines represent cells stained without primary antibody. (C) FACS analysis of Notch1 expression in a Notch1-deficient ES cell line, treated identically to wild-type lines analyzed in panel B. (D) FACS analysis of Notch1 expression in the early mouse embryo. Approximately 8.25-dpc wild-type embryos were dissociated to single cells and pooled for analysis similar to EB analysis. The profile indicated by dotted lines represents cells stained without primary antibody. Percentage of cells in the M2 window is shown. (E) Staining for an activated epitope of Notch1 in a section of an approximately 7.5-dpc wild-type embryo with an antibody to the N-terminus of the intracellular domain of Notch1 (NICD). Nuclear staining is indicated by Bis-benzimide (green) and NICD is indicated in red. Yellow cells represent specific nuclear NICD staining. Note positive NICD detection in the mesodermal layer of the embryo proper (arrowhead) but absence of detection in the presumptive blood island aggregates in the extraembryonic region (arrow). Similar staining patterns were observed in multiple sections from 3 different wild-type embryos at approximately 7.5 dpc. Image was visualized using Olympus 100×/1.25 oil objective lenses. Magnification, ×100.
Figure 4
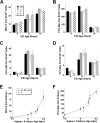
Figure 4. Notch1-deficient (Notch1in32 allele) EBs and early embryos display normal definitive colony-forming unit (CFU) progenitor activity
(A-D) EBs differentiated in liquid culture for 6, 8, or 10 days were trypsinized to obtain single-cell suspensions and replated to assay for the following definitive colony-forming progenitors: (A) burst-forming unit–erythroid (BFU-E), (B) colony-forming unit– macrophage (CFU-Mac) (C) colony-forming unit–granulocyte/monocyte (CFU-GM), or for (D) colony-forming unit–mix (CFU-Mix). Values represent the average of 3 replicate platings and error bars indicate SD. Similar results were obtained in independent experiments from EBs differentiated for 10 or 12 days. Wild type (+/+), Notch1 heterozygous (+/−), and 2 independently derived Notch1 null (−/−) ES cell lines were examined. (E-F) Notch1-deficient embryos or littermate controls were dissected at various stages of development. The entire embryo or the dissected yolk sac was dispersed to a single-cell suspension and assayed in methylcellulose with cytokines for the following definitive colony-forming progenitors: (E) definitive erythroid (BFU-E) and (F) macrophage (CFU-Mac). Each time point represents the average number of CFUs from Notch1-deficient (−/−) or control (+/− or +/+) littermate embryos whose approximate chronologic age was based on morphology and/or somite numbers. Error bars represent SD. Similar results not shown in this graph were obtained in additional experiments performed at various embryonic stages.
Figure 5
Figure 5. Generation and hematopoietic analysis of embryos chimeric for Notch1-deficient (Notch1Δ1 allele) or wild-type (control) cells marked by ROSA26
(A) Schematic representation of generation of chimeric embryos. Primary Notch1−/− or wild-type ES cell lines containing the ROSA26 gene were independently derived from blastocysts. These ES lines were injected into wild-type blastocysts to obtain chimeric embryos. At various stages of development (Table 1), the yolk sac (YS), a portion of fetal liver (FL), or bone marrow (BM) was dissected out and dispersed cells were plated for hematopoietic CFU activity and the remaining embryo (or dissected organs) was stained with X-gal. Only those embryos that contained widespread, substantial contribution of LacZ+ cells by gross visualization of stained tissues were included in the hematopoietic analysis. Hematopoietic colonies were stained with X-gal and CFUs scored in order to determine relative percent contribution of ES-derived (LacZ+) and blastocyst-derived (LacZ) cells. (B) A representative LacZ+ colony from Notch1-deficient (ES derived) cells from a chimeric embryo and LacZ colony from Notch1+/+ (embryo derived) cells from a chimeric embryo. Images were visualized using Olympus 60 ×/1.4 oil objective lenses. (C) DNA samples from single LacZ (embryo-derived Notch1+/+) or LacZ+ (ES-derived Notch12−/−) colonies were isolated and used for PCR to genotype colonies.
Figure 6
Figure 6. Distinct Notch1 requirement in developmental hematopoiesis
Notch1 is required only for the development of the long-term definitive hematopoietic stem cell compartment while dispensable for earlier, short-term definitive hematopoietic progenitors that are detected in embryoid bodies from in vitro ES cell differentiation and the early yolk sac/fetal liver in vivo. In contrast, the critical hematopoietic transcription factor SCL is required for the development of all hematopoietic progenitors, primitive and definitive, and the transcription factor Runx1 is required for all definitive, but not primitive, progenitors.,

Similar articles

Cited by

References

    1. Palis J, Robertson S, Kennedy M, Wall C, Keller G. Development of erythroid and myeloid progenitors in the yolk sac and embryo proper of the mouse. Development. 1999;126:5073–5084. - PubMed
    1. Palis J, Chan RJ, Koniski A, Patel R, Starr M, Yoder MC. Spatial and temporal emergence of high proliferative potential hematopoietic precursors during murine embryogenesis. Proc Natl Acad Sci U S A. 2001;98:4528–4533. - PMC - PubMed
    1. McGrath KE, Koniski AD, Malik J, Palis J. Circulation is established in a stepwise pattern in the mammalian embryo. Blood. 2003;101:1669–1676. - PubMed
    1. Godin IE, Garcia-Porrero JA, Coutinho A, Dieterlen-Lievre F, Marcos MA. Para-aortic splanchnopleura from early mouse embryos contains B1a cell progenitors. Nature. 1993;364:67–70. - PubMed
    1. Cumano A, Dieterlen-Lievre F, Godin I. Lymphoid potential, probed before circulation in mouse, is restricted to caudal intraembryonic splanchnopleura. Cell. 1996;86:907–916. - PubMed

Publication types

MeSH terms

Substances