

Older age becomes common late in human evolution
- PMID: 15252198
- PMCID: PMC503716
- DOI: 10.1073/pnas.0402857101
Older age becomes common late in human evolution
Abstract
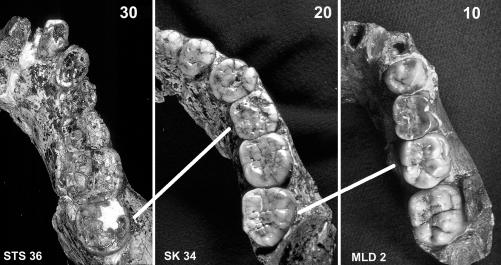
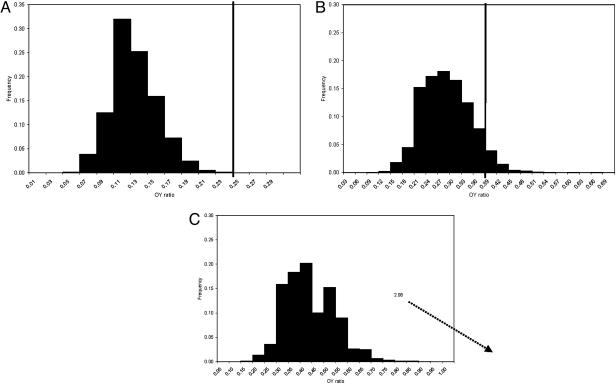
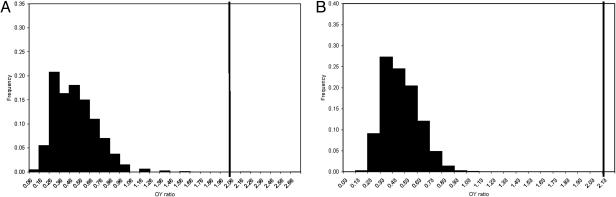
Increased longevity, expressed as number of individuals surviving to older adulthood, represents one of the ways the human life history pattern differs from other primates. We believe it is a critical demographic factor in the development of human culture. Here, we examine when changes in longevity occurred by assessing the ratio of older to younger adults in four hominid dental samples from successive time periods, and by determining the significance of differences in these ratios. Younger and older adult status is assessed by wear seriation of each sample. Whereas there is significant increased longevity between all groups, indicating a trend of increased adult survivorship over the course of human evolution, there is a dramatic increase in longevity in the modern humans of the Early Upper Paleolithic. We believe that this great increase contributed to population expansions and cultural innovations associated with modernity.
Figures
Comment in
-
Living longer: Information revolution, population expansion, and modern human origins.Proc Natl Acad Sci U S A. 2004 Jul 27;101(30):10847-8. doi: 10.1073/pnas.0404198101. Epub 2004 Jul 19. Proc Natl Acad Sci U S A. 2004. PMID: 15263080 Free PMC article. No abstract available.
-
Paleodemography, grandmothering, and modern human evolution: a comment on Caspari and Lee (2004).J Hum Evol. 2005 Nov;49(5):643-5; discussion 646-9. doi: 10.1016/j.jhevol.2005.04.011. Epub 2005 Sep 6. J Hum Evol. 2005. PMID: 16143366 No abstract available.
-
How old is human longevity?J Hum Evol. 2005 Nov;49(5):650-3; discussion 654-9. doi: 10.1016/j.jhevol.2005.04.012. Epub 2005 Oct 14. J Hum Evol. 2005. PMID: 16226787 No abstract available.
Similar articles
-
Is human longevity a consequence of cultural change or modern biology?Am J Phys Anthropol. 2006 Apr;129(4):512-7. doi: 10.1002/ajpa.20360. Am J Phys Anthropol. 2006. PMID: 16342259
-
Palaeodemography of the Atapuerca-SH Middle Pleistocene hominid sample.J Hum Evol. 1997 Aug-Sep;33(2-3):333-55. doi: 10.1006/jhev.1997.0110. J Hum Evol. 1997. PMID: 9300346
-
Dental remains from the Grotte du Renne at Arcy-sur-Cure (Yonne).J Hum Evol. 2006 May;50(5):485-508. doi: 10.1016/j.jhevol.2005.11.008. Epub 2006 Feb 17. J Hum Evol. 2006. PMID: 16487991
-
[Growth and developmental patterns in Neandertals].Kaibogaku Zasshi. 2000 Apr;75(2):231-9. Kaibogaku Zasshi. 2000. PMID: 10824515 Review. Japanese.
-
Reconstructing life history of hominids and humans.Coll Antropol. 2003 Jun;27(1):7-22. Coll Antropol. 2003. PMID: 12974130 Review.
Cited by
-
The active grandparent hypothesis: Physical activity and the evolution of extended human healthspans and lifespans.Proc Natl Acad Sci U S A. 2021 Dec 14;118(50):e2107621118. doi: 10.1073/pnas.2107621118. Proc Natl Acad Sci U S A. 2021. PMID: 34810239 Free PMC article. Review.
-
The Gut and Parkinson's Disease-A Bidirectional Pathway.Front Neurol. 2019 Jun 4;10:574. doi: 10.3389/fneur.2019.00574. eCollection 2019. Front Neurol. 2019. PMID: 31214110 Free PMC article. Review.
-
How culture shaped the human genome: bringing genetics and the human sciences together.Nat Rev Genet. 2010 Feb;11(2):137-48. doi: 10.1038/nrg2734. Nat Rev Genet. 2010. PMID: 20084086 Review.
-
Mate choice and the origin of menopause.PLoS Comput Biol. 2013;9(6):e1003092. doi: 10.1371/journal.pcbi.1003092. Epub 2013 Jun 13. PLoS Comput Biol. 2013. PMID: 23785268 Free PMC article.
-
Long-term gene-culture coevolution and the human evolutionary transition.Proc Biol Sci. 2021 Jun 9;288(1952):20210538. doi: 10.1098/rspb.2021.0538. Epub 2021 Jun 2. Proc Biol Sci. 2021. PMID: 34074122 Free PMC article. Review.
References
-
- Hill, K. & Kaplan, H. (1999) Annu. Rev. Anthropol. 28, 397–430. - PubMed
-
- Kaplan, H., Hill, K., Lancaster, J. & Hurtado, A. M. (2000) Evol. Anthropol. 9, 156–185.
-
- Hill, K. & Hurtado, A. M. (1996) Ache Life History: The Ecology and Demography of a Foraging People (de Gruyter, New York).
-
- Hawkes, K. (2003) Am. J. Hum. Biol. 15, 380–400. - PubMed
MeSH terms
LinkOut - more resources
Full Text Sources
