

doi: 10.1073/pnas.0403849101.
Epub 2004 Jul 13.
From the Cover: The dynamics of genomic-length DNA molecules in 100-nm channels
Affiliations
- PMID: 15252203
- PMCID: PMC503729
- DOI: 10.1073/pnas.0403849101
Item in Clipboard
From the Cover: The dynamics of genomic-length DNA molecules in 100-nm channels
Proc Natl Acad Sci U S A.
.
Abstract
We show that genomic-length DNA molecules imaged in nanochannels have an extension along the channel that scales linearly with the contour length of the polymer, in agreement with the scaling arguments developed by de Gennes for self-avoiding confined polymers. This fundamental relationship allows us to measure directly the contour length of single DNA molecules confined in the channels, and the statistical analysis of the dynamics of the polymer in the nanochannel allows us to compute the SD of the mean of the extension. This statistical analysis allows us to measure the extension of lambda DNA multimers with a 130-nm SD in 1 min.
Figures
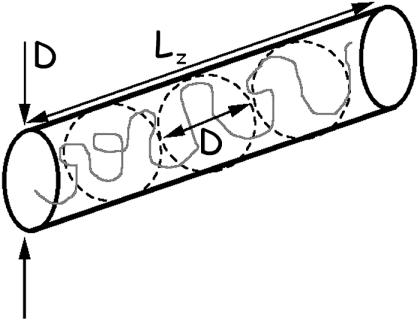
When the DNA polymer is confined to a channel of diameter D, the polymer must elongate to some end-to-end distance Lz(D). In a confining tube, the polymer must elongate as a series of “blobs,” which cannot interpenetrate because of self-avoidance. Thus, in a tube of diameter D, we have  .
.
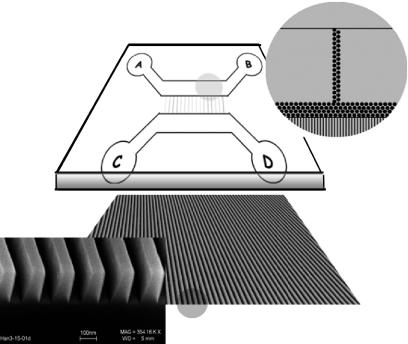
The assembly of a sealed 100-nm-wide nanochannel array with a microfabricated coverslip. The nanoimprinted chips were made in fused silica (thickness, 1 mm) obtained from ValleyDesign (Westford, MA). The cover chips were patterned by using standard UV-lithographical techniques and reactiveion etching. Access holes were defined by using sand blasting. The cover chips were made in fused silica obtained from Hoya (Tokyo). DNA molecules from the gel were moved along the path from well A to well B, and a driving voltage was used to transfer molecules into wells C and D through the nanochannels on the mating nanoimprinted quartz wafer. Posts of 1 μm in diameter that were separated by 2 μm were used to prestretch the genomic length molecules to facilitate entry into the nanochannels and decrease the entropic barrier (20, 21).
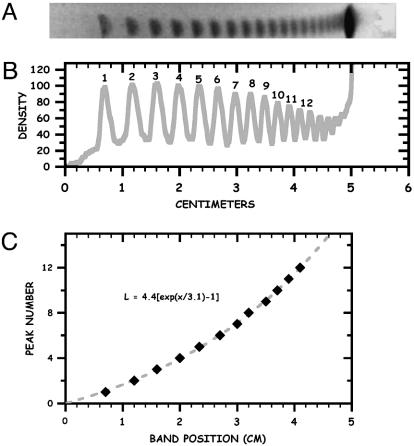
Analysis of pulsed-field gels. (A) Gel of the λ-ladder used in this experiment. (B) Scanned density of the gel lane, with N-mer labeling. An applied electric field of 5 V/cm was used, with the field direction switching ±60° to the average direction, with a period that was linearly ramped from 5–120 s over the entire run (≈18 h). (C) Result of curvefiting the peak number n from B to the empirical relation β [exp(χ/γ) – 1] = L, with L = 0 set by the predicted position of the n = 0 effective solvent front, with a β value of 4.4 and a γ value of 3.1 cm. Positions of the peaks are shown by diamonds, and the curve fit is shown by the dashed line.
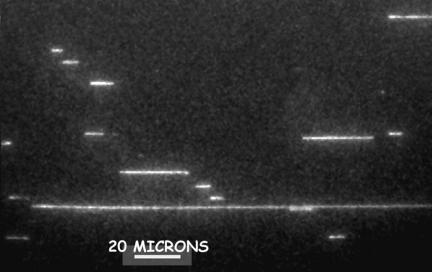
Typical digital camera frame with a 0.1-s exposure time. The camera was an iPentamax ICCD (Roper Scientific, Trenton, NJ) on a Eclipse TE300 microscope (Nikon) and a ×60 PlanApo (Nikon) numerical aperture 1.4 oilimmersion objective. A laser beam from an argon–krypton laser (Coherent Radiation, Palo Alto, CA) was raster scanned over the wafer by using a orthogonal pair of servocontrolled mirrors (Cambridge Scientific, Cambridge, MA) so that excitation density over the wafer was highly uniform. The protocol was to turn on an electrophoretic field for ≈2 s, remove previously measured molecules, and bring in a new set of molecules. The camera took ≈20 frames at 10 Hz, the frames were digitally stored to a disk, and the process was repeated. The running buffer contained 5 μM benzothiazolium-4-quinolinium dimer (TOTO-1) dye, Tris·EDTA buffer with boric acid (0.5× TBE), antibleaching agent DTT, and 0.1% POP6 (Applied Biosystems) to suppress any electroendosmosis.
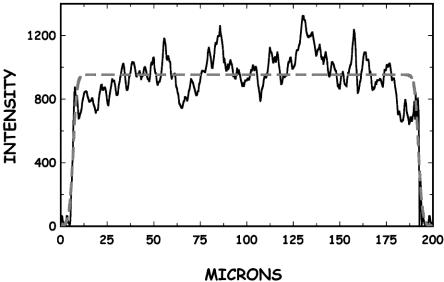
Intensity vs. length of a confined DNA molecule with Lz = 185 μm. The dashed line is the fit of the data.
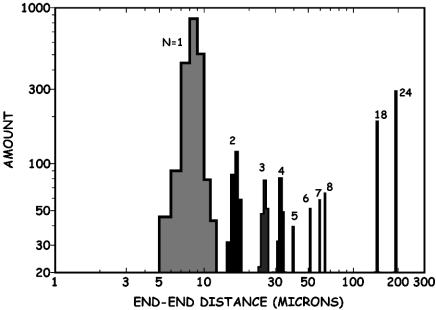
A histogram of end-to-end distances Lz of molecules observed in 2 min of running DNA molecules into 100-nm-width nanochannels vs. the amount of DNA is shown, as described in the text. The assignment of the single DNA molecules to n = 5–8 is based on the assumption that Lz ≃ L.
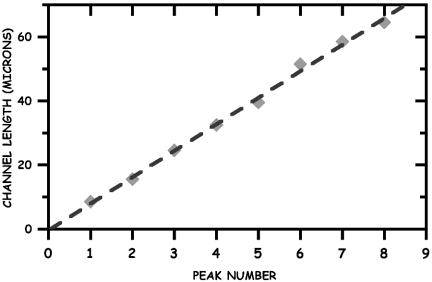
Observed end-to-end distance vs. the N-mer ligation value. The data are shown as diamonds, and a linear fit is shown by the dashed line.
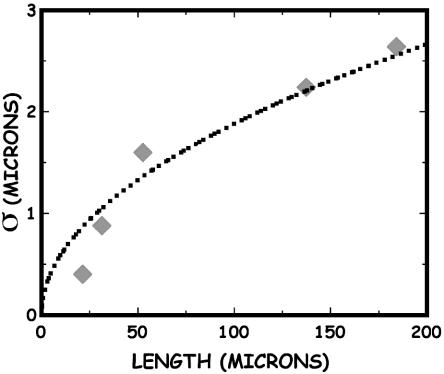
The observed SD in the length of a confined channel of width 100 nm vs. the length of the molecule. The dashed line is a fitofEq. 3 to the data.
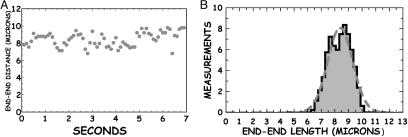
The end-to-end dynamics of a confined DNA molecule. (A) End-to-end distance of a λ monomer confined in a 100-nm-wide channel as a function of time. (B) Histogram of the observed end-to-end distances Lz of the monomer data. The SD of the mean length of 8.38 μm is 0.15 μm, as determined by the Guassian curve fit (dashed line).
References
-
- Slater, G. W., Desrulsseaux, C., Hubert, S. J., Mercier, J. F., Labrie, J., Boileau, J., Tessier, F. & Pepin, M. P. (2000) Electrophoresis 21, 3873–3887. - PubMed
-
- Lin, J., Qi, R., Aston, C., Jing, J., Anantharaman, T. S., Mishra, B., White, O., Daly, M. J., Minton, K. W., Venter, J. C. & Schwartz, D. C. (1999) Science 285, 1558–1562. - PubMed
-
- Flory, P. J. (1953) Principles of Polymer Chemistry (Cornell Univ. Press, Ithaca, NY).
-
- Schaefer, D. W., Joanny, J. F. & Pincus, P. (1980) Macromolecules 13, 1280–1289.
-
- Smith, D. E., Perkins, T. T. & Chu, S. (1996) Macromolecules 29, 1372–1373.
Publication types
MeSH terms
Substances
Grants and funding
LinkOut - more resources
Full Text Sources
Other Literature Sources
